The companies with the highest revenue
Revenue for the latest fiscal year, in U.S. dollars, from each company’s annual report (converted where the company reports in another currency).
- Companies ranked
- 180
- No. 1
- Amazon
- Middle of the pack
- $28.0B
- Updated
- 2026
-
 No. 2 Walmart $713B FY2026 · Bentonville, Arkansas
 -
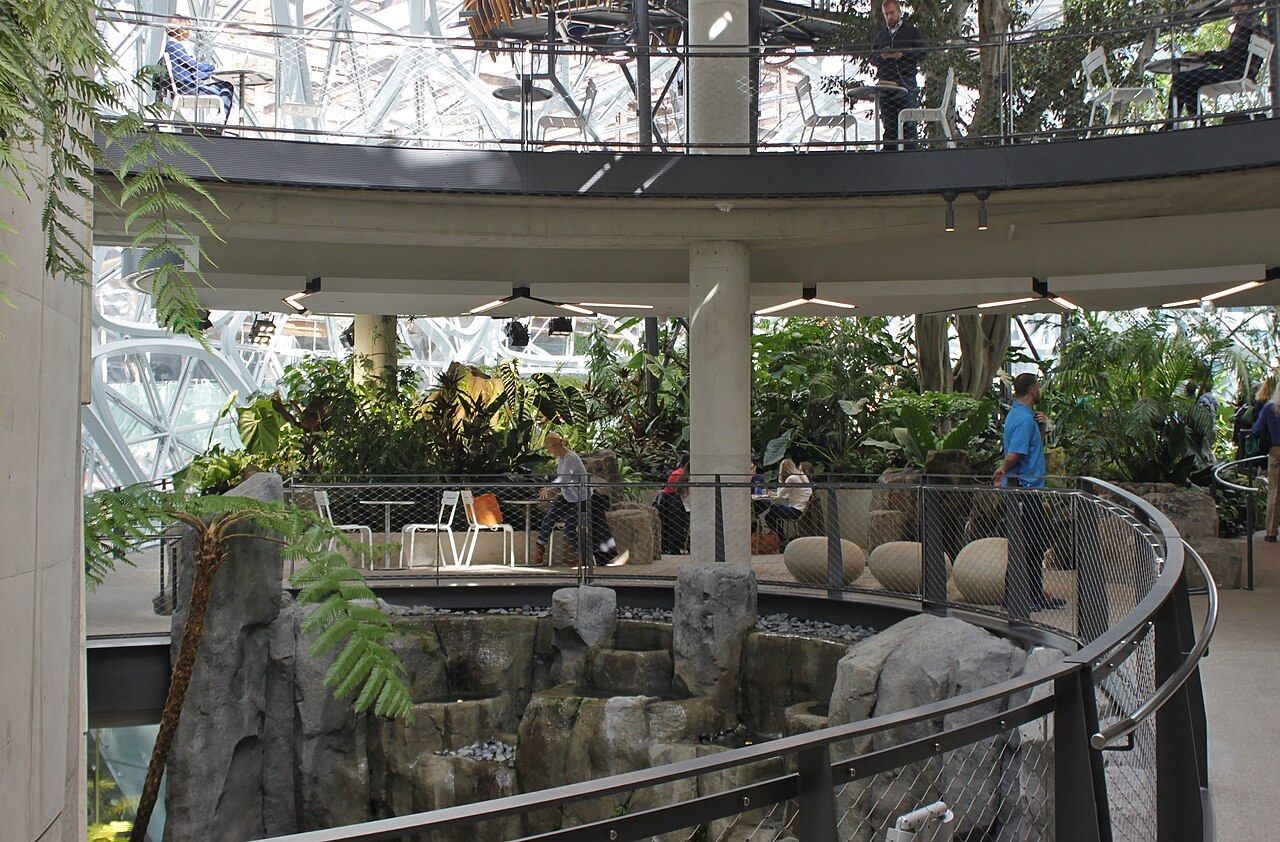 No. 1 Amazon $717B 2025 · Seattle, Washington
 -
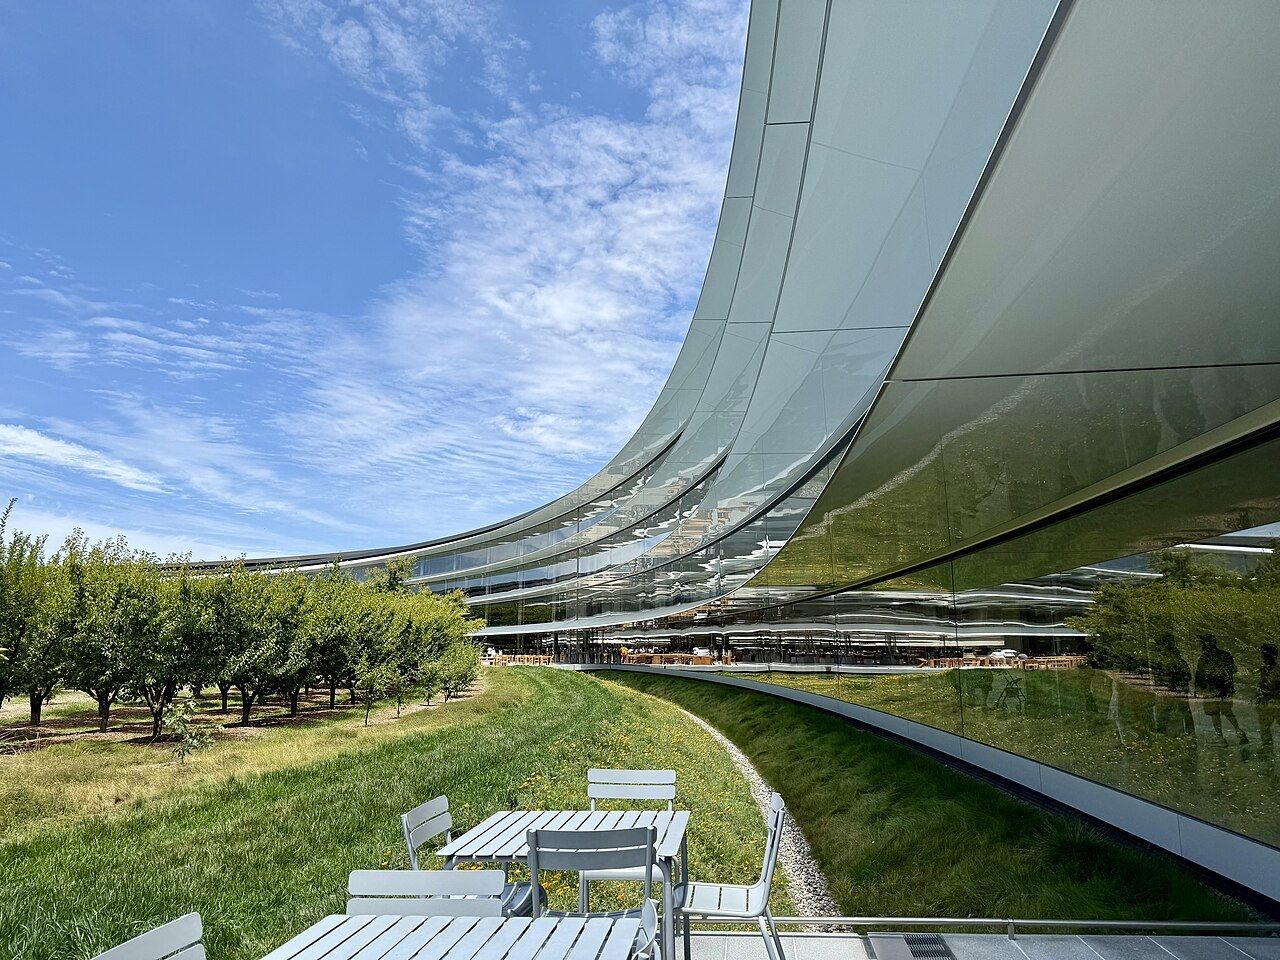 No. 3 Apple $416B FY2025 · Cupertino, California
Full ranking
- 1 Amazon $717B2025
- 2 Walmart $713BFY2026
- 3 Apple $416BFY2025
- 4
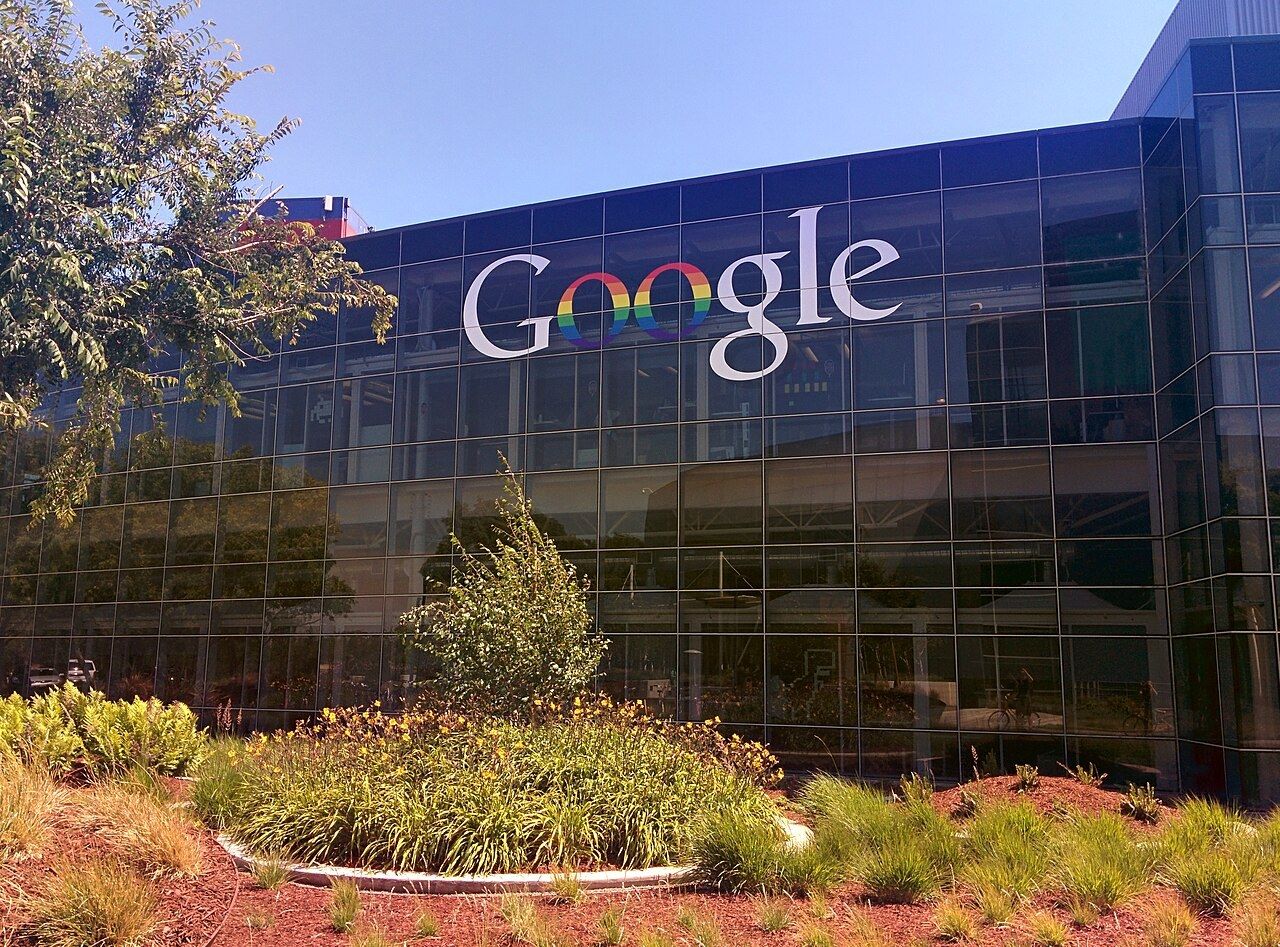 Google $403B2025
 - 5
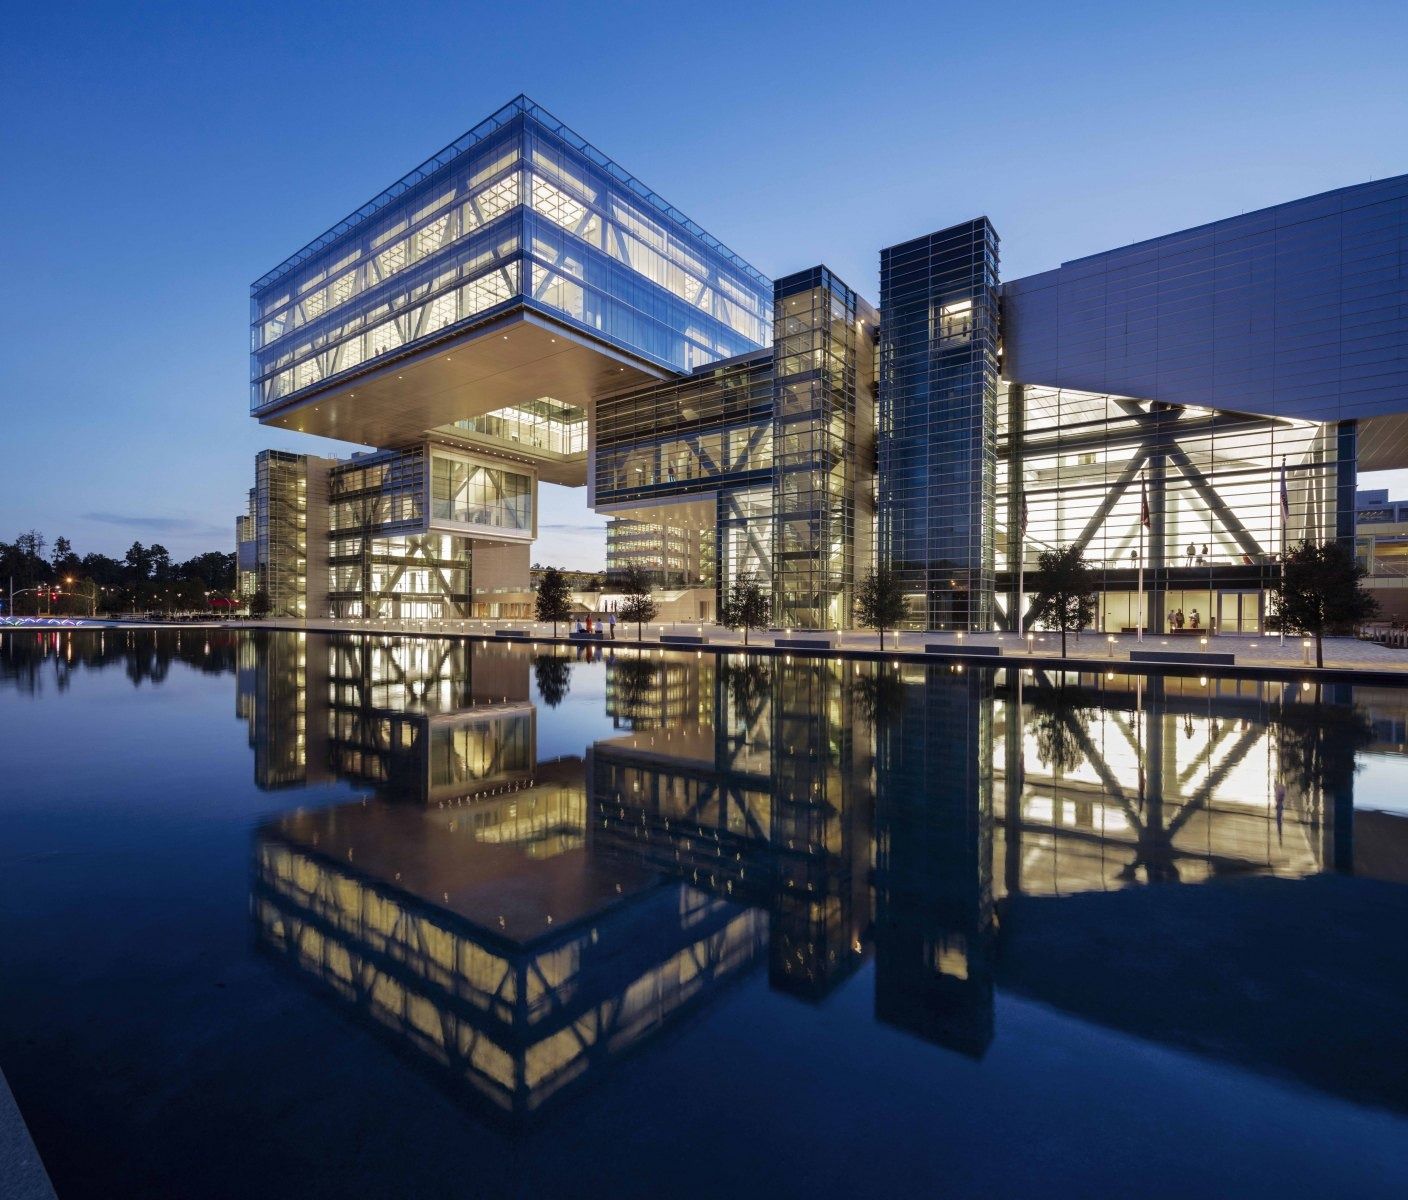 ExxonMobil $332BFY2025
 - 6
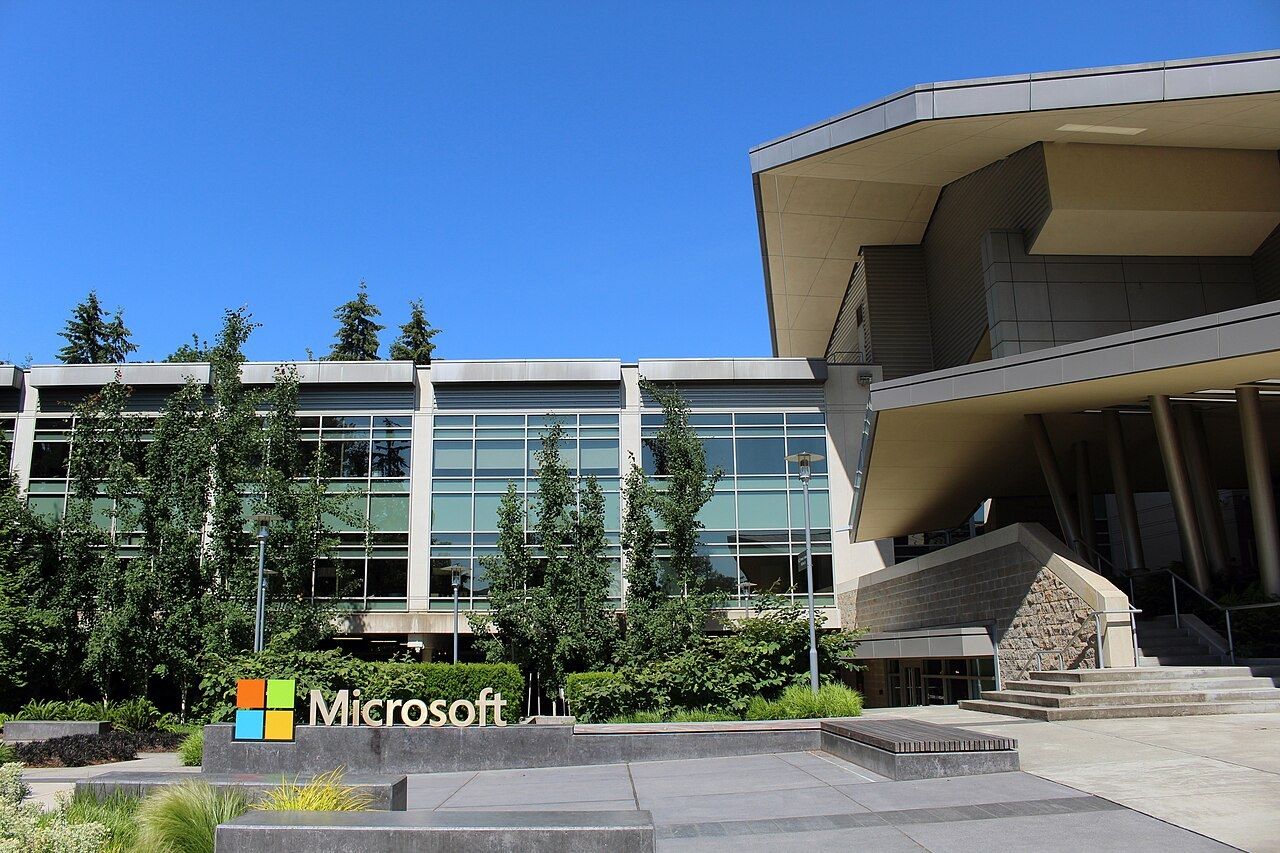 Microsoft $332BFY2026
 - 7
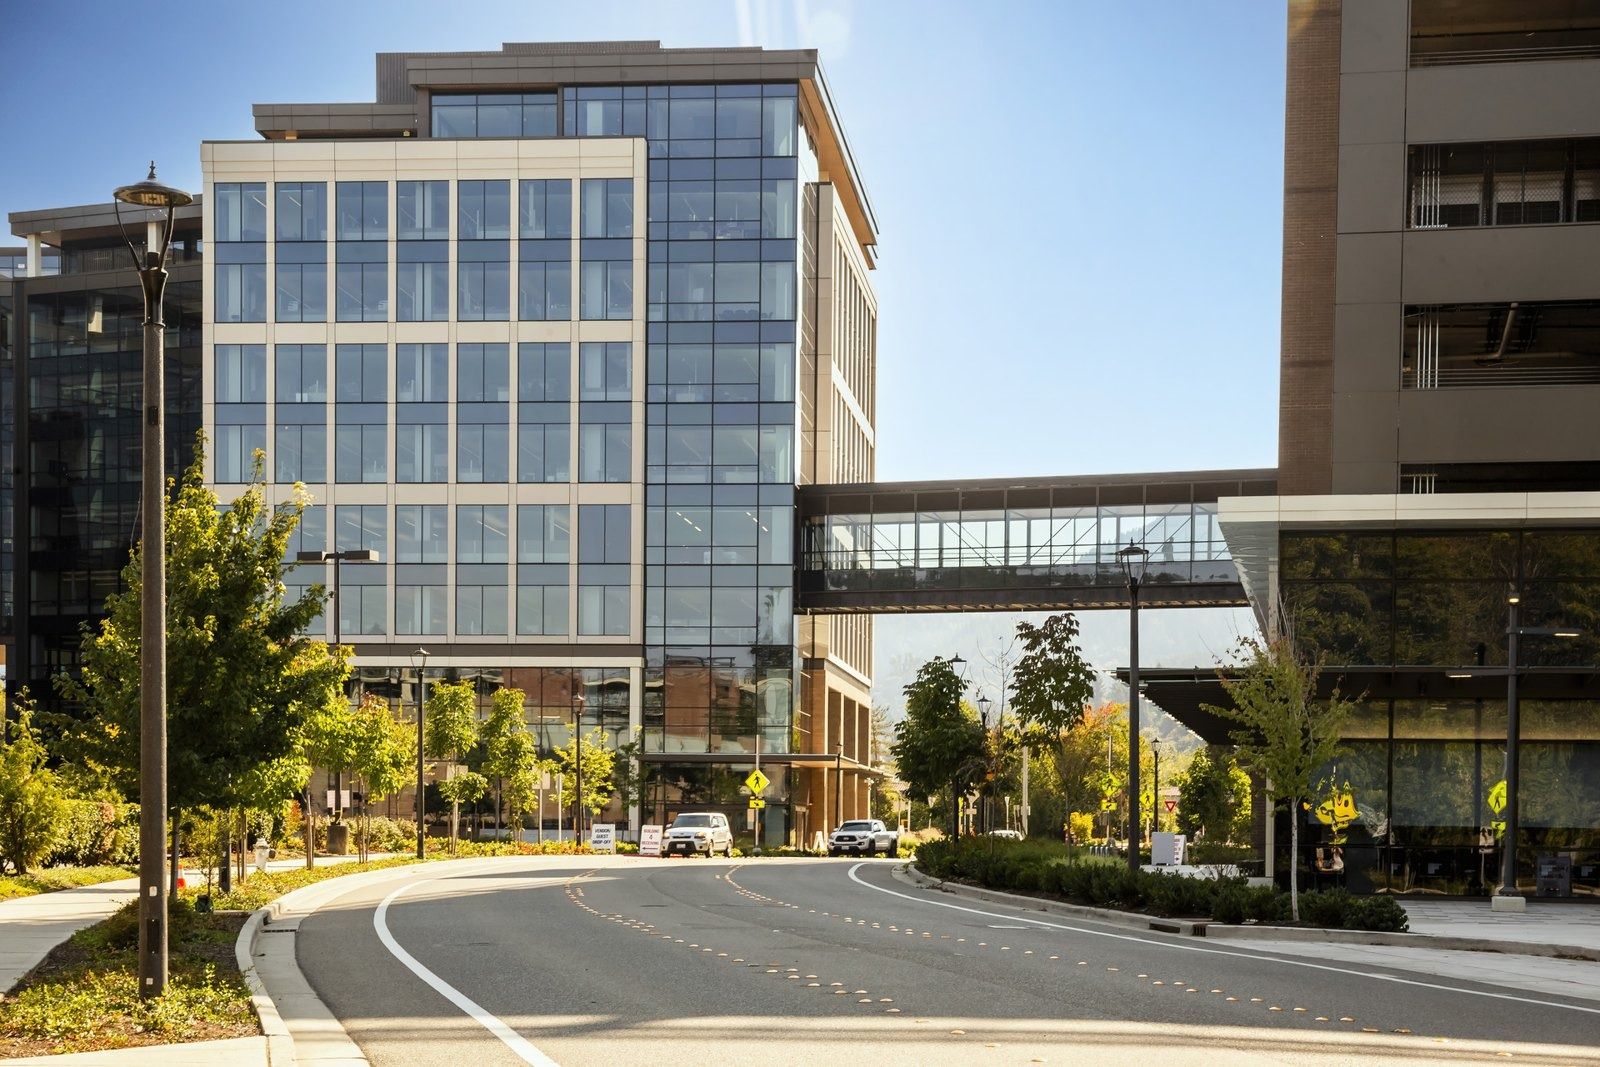 Costco Wholesale $303BFY2026
 - 8
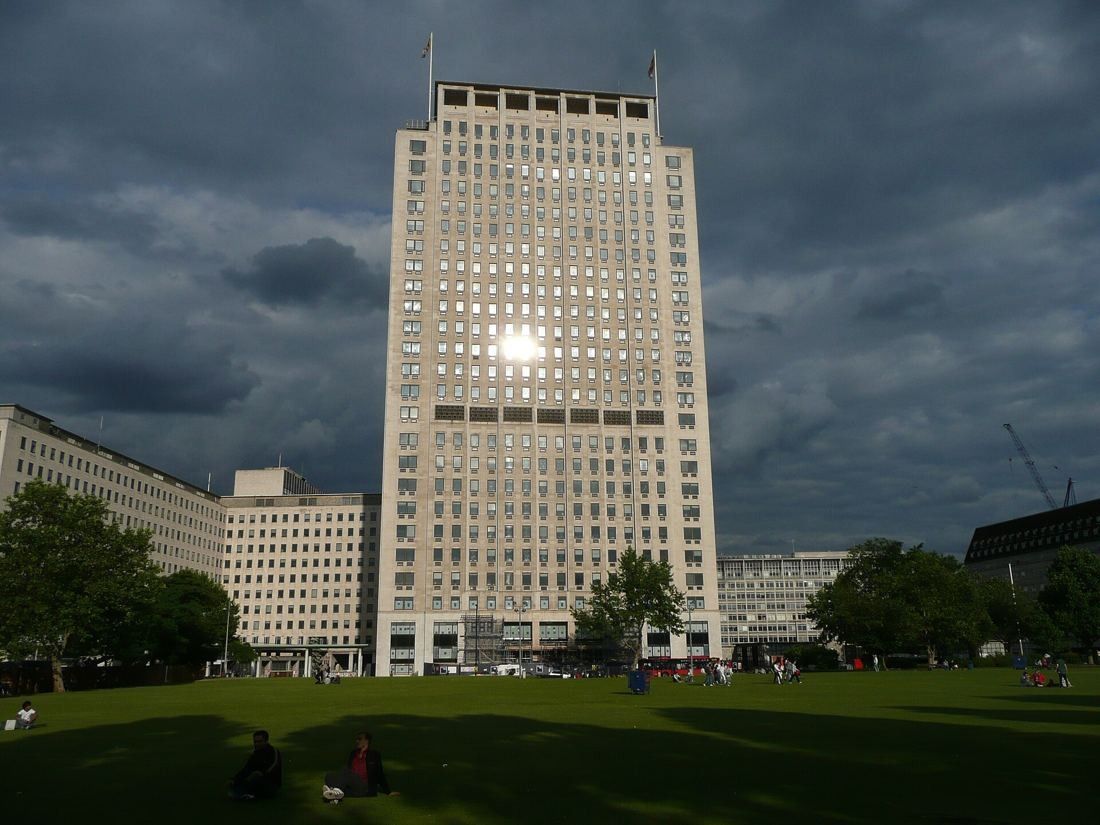 Shell $267B2025
 - 9
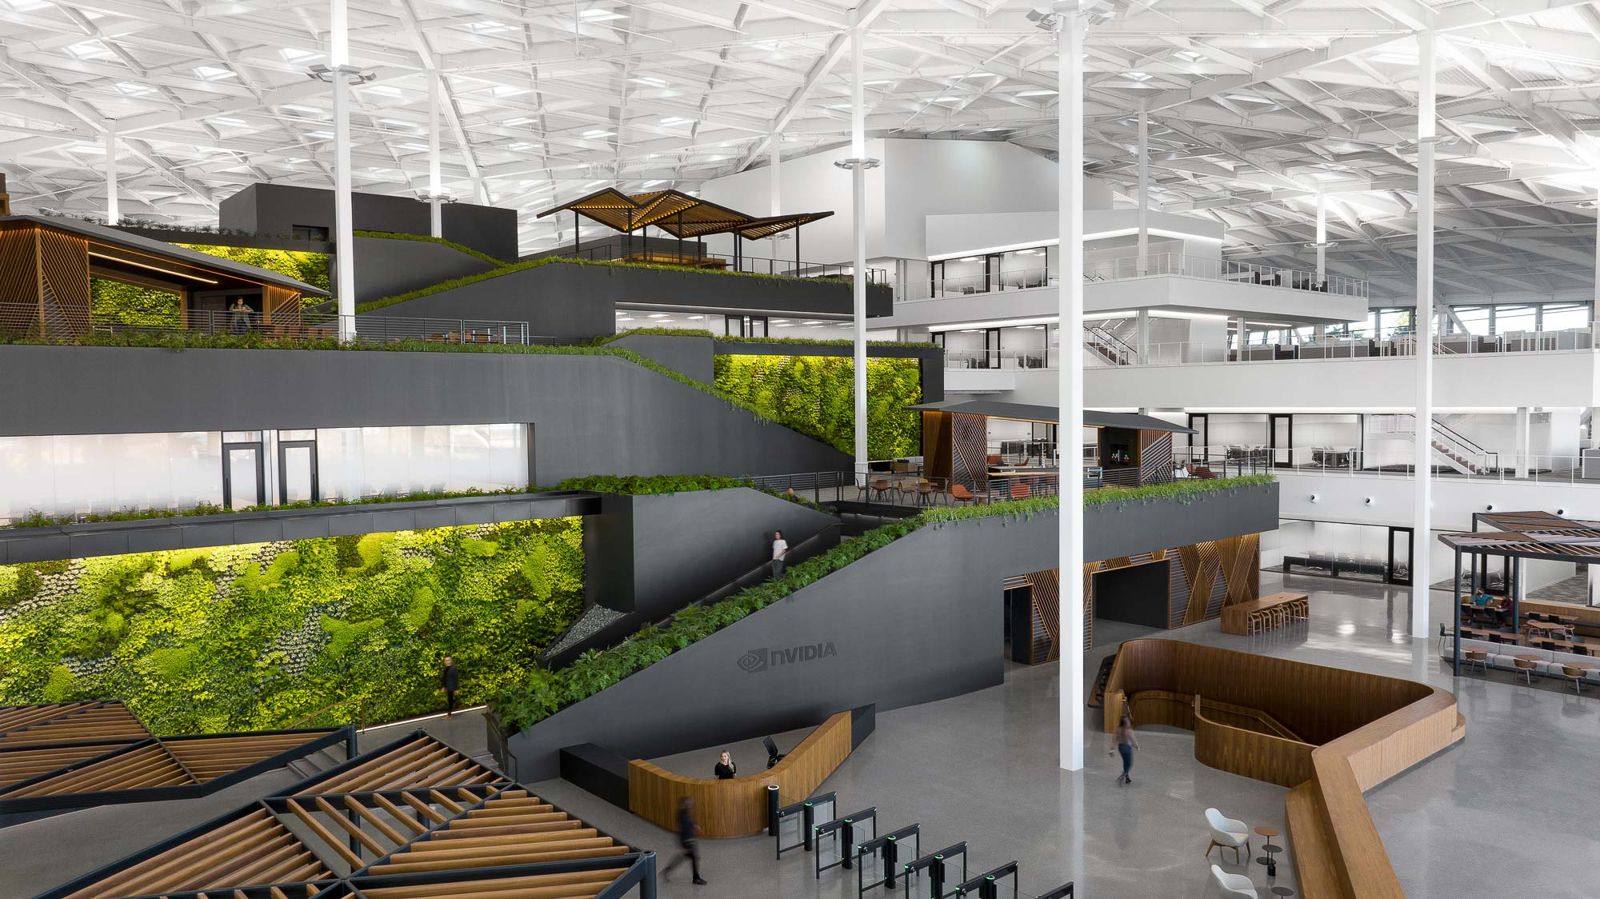 NVIDIA $216BFY2026
 - 10
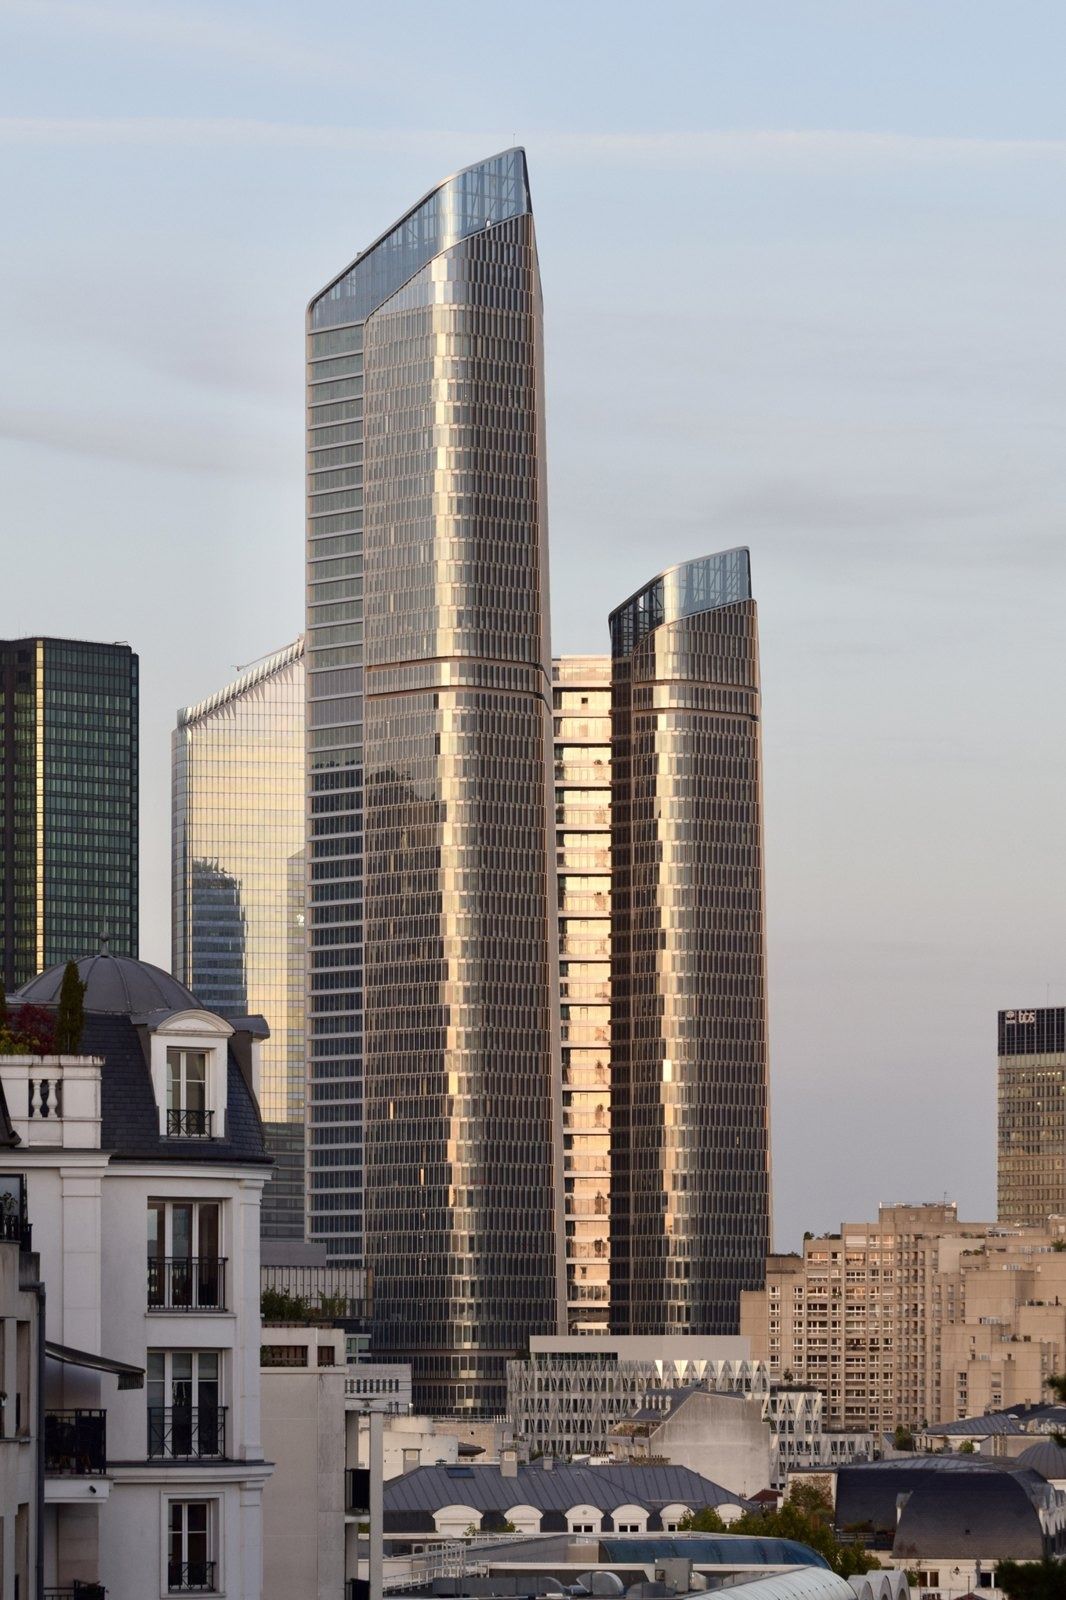 TotalEnergies $201B2025
 - 11
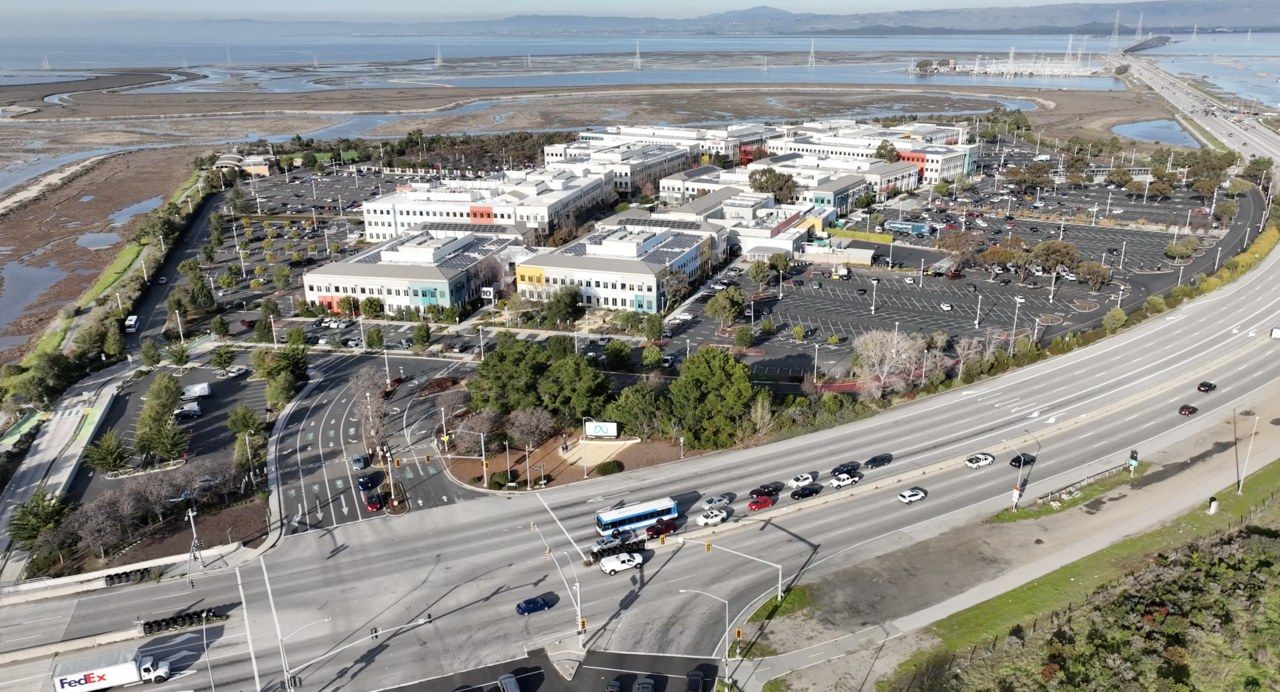 Meta $201B2025
 - 12
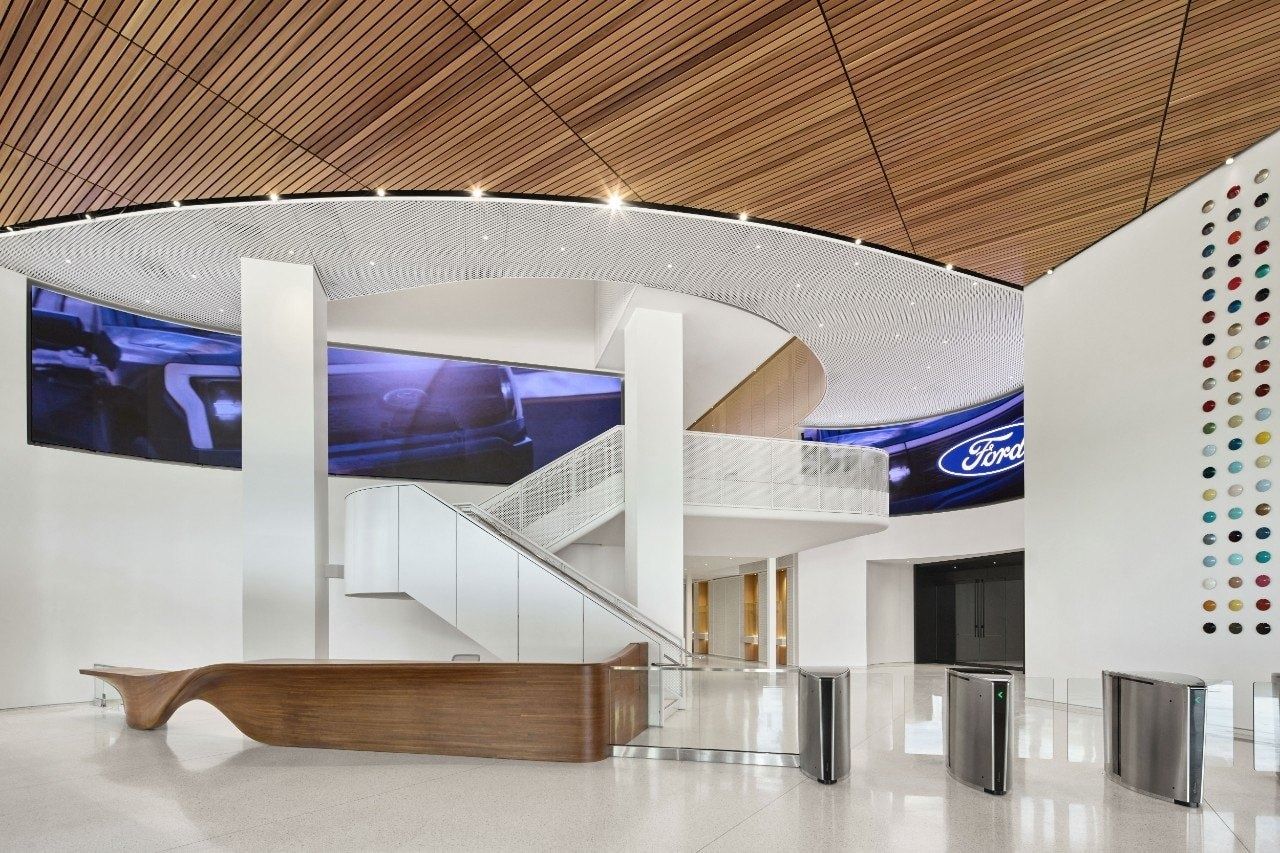 Ford Motor Company $187BFY2025
 - 13
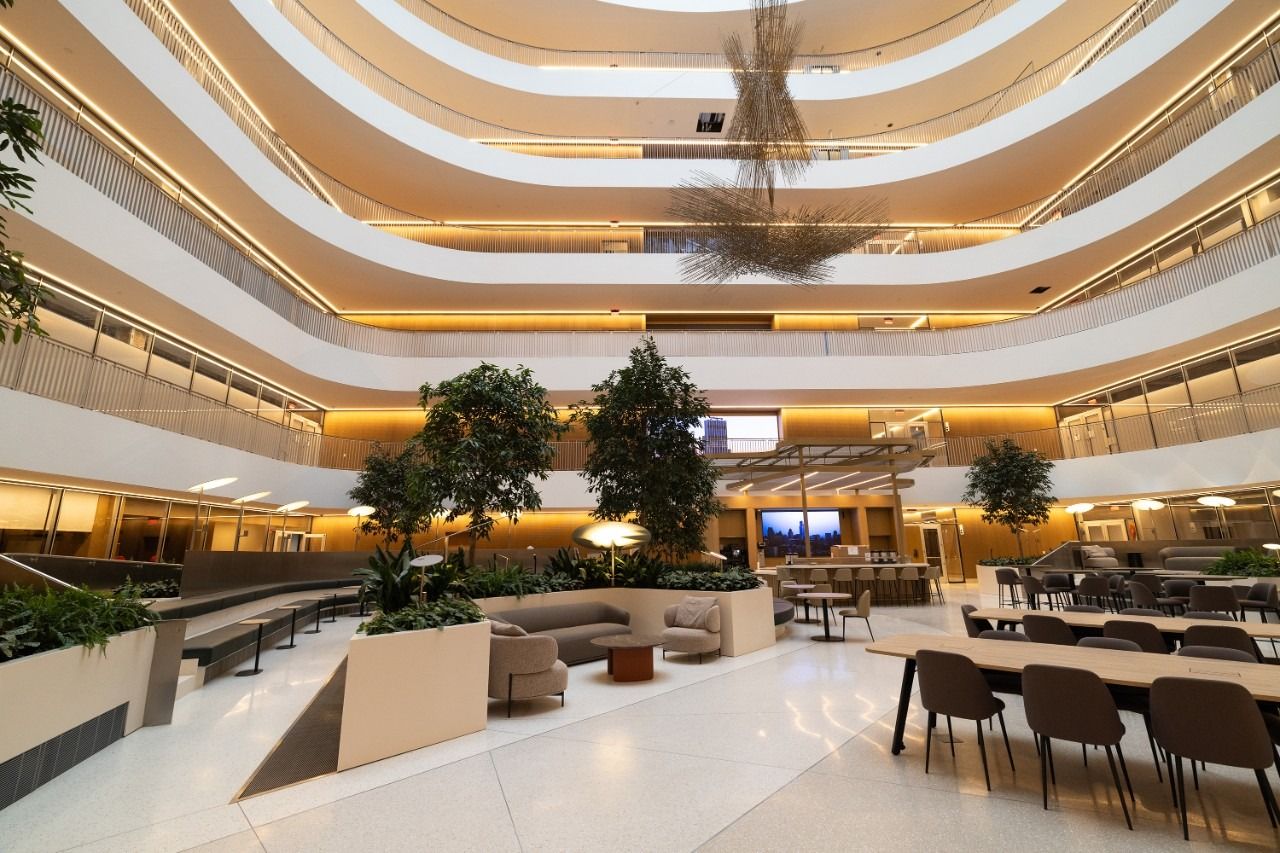 General Motors $185BFY2025
 - 14
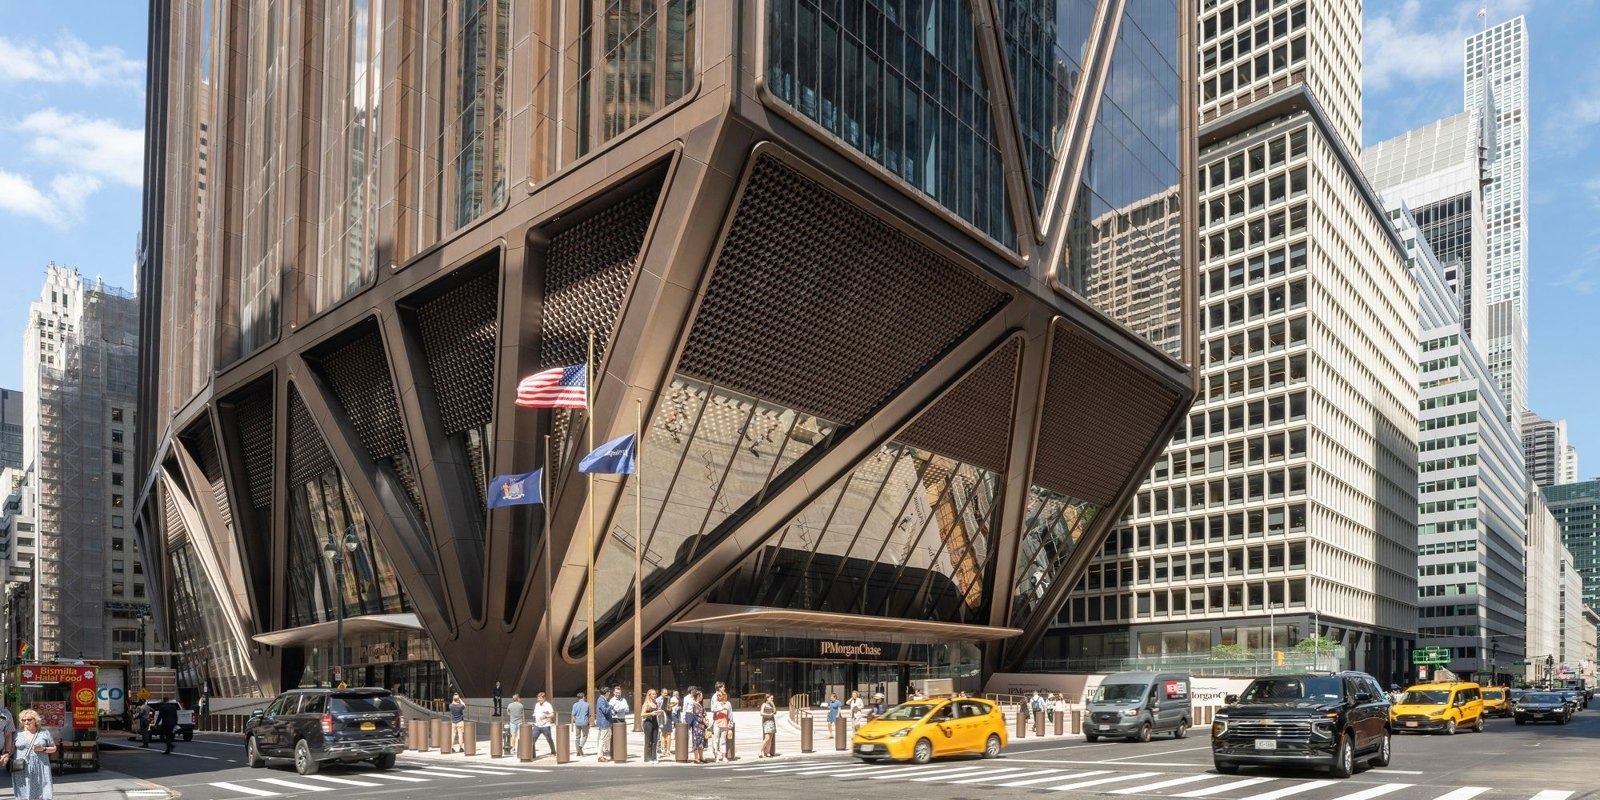 JPMorganChase $182B2025
 - 15
 The Home Depot $165BFY2025
 - 16
 BMW Group ≈$151B2025
 - 17
 Phillips 66 $132B2025
 - 18
 AT&T $126B2025
 - 19
 Comcast $124BFY2025
 - 20
 TSMC $122B2025
 - 21
 Dell Technologies $114BFY2026
 - 22
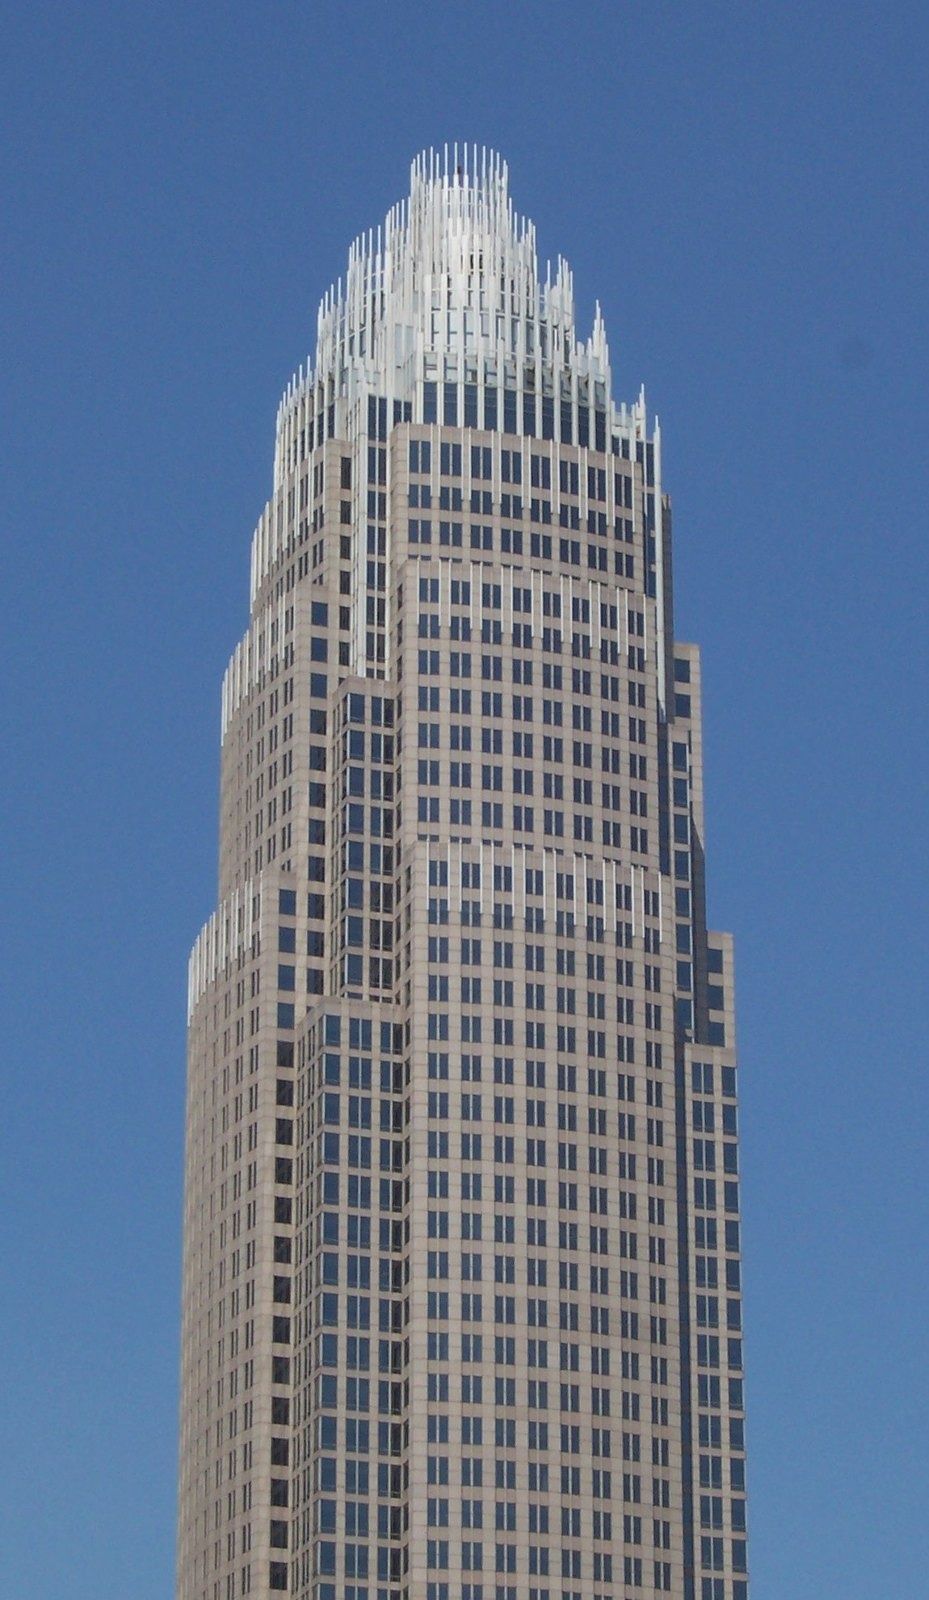 Bank of America $113B2025
 - 23
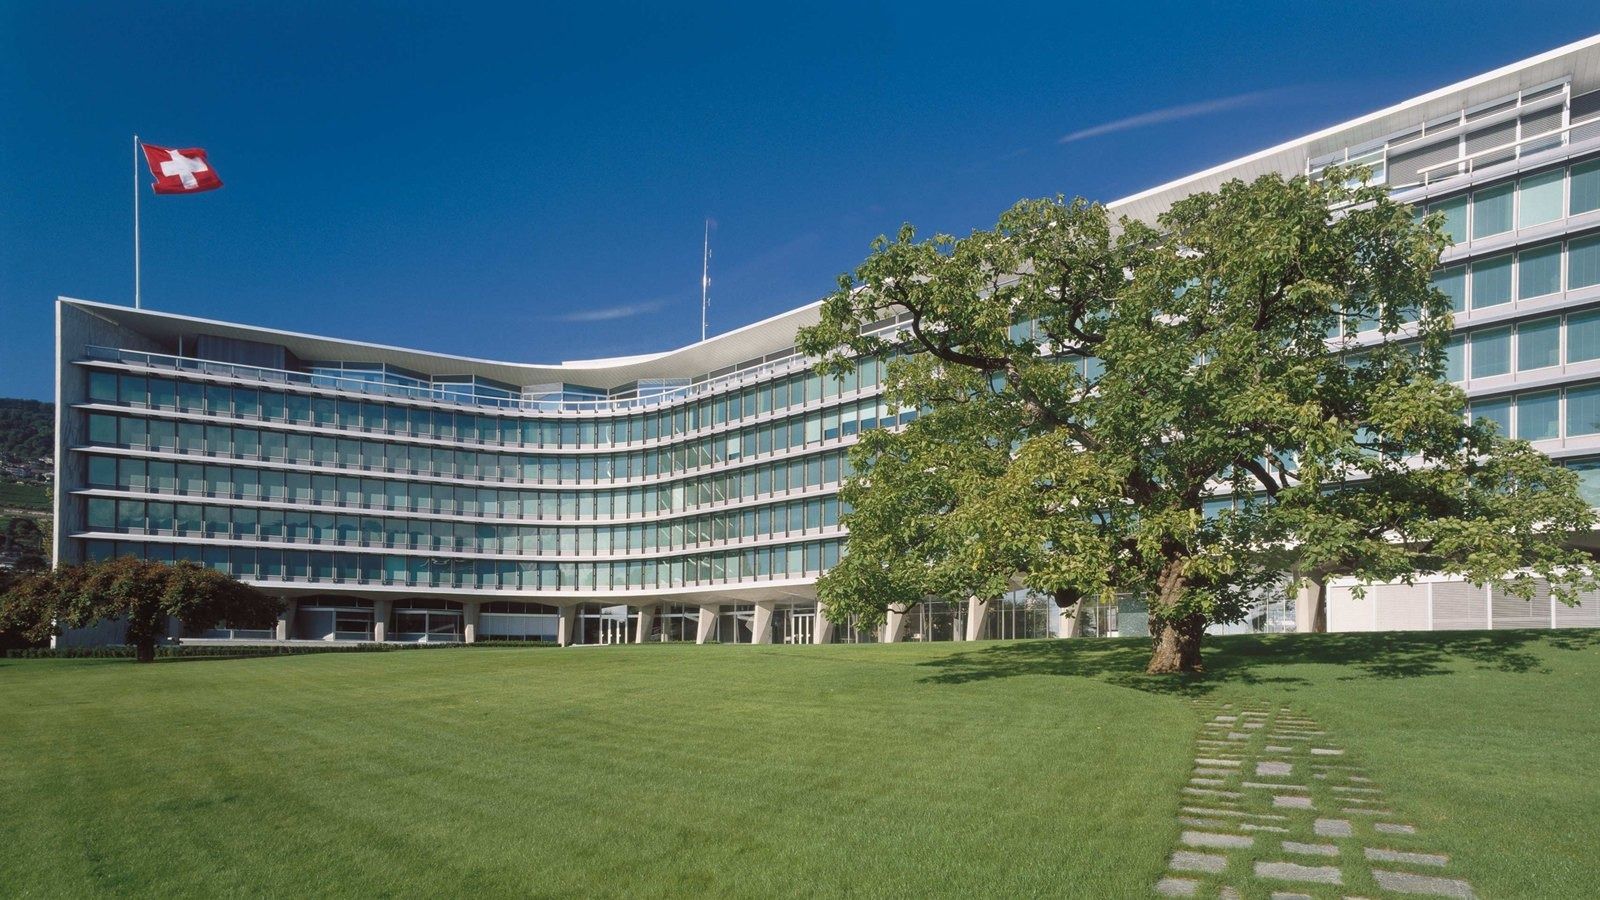 Nestlé ≈$108B2025
 - 24
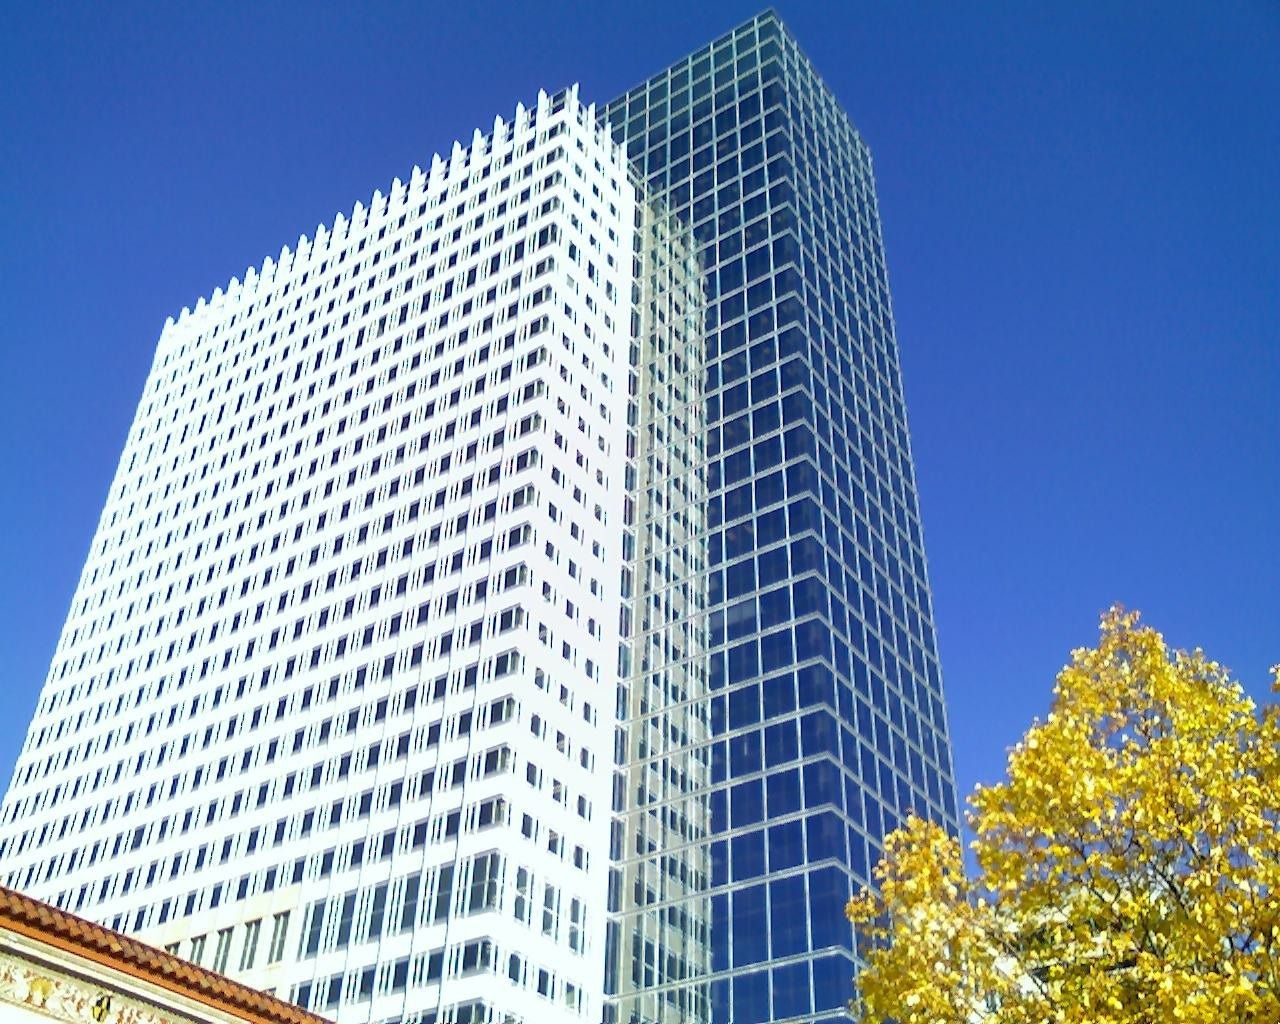 Target $105BFY2025
 - 25
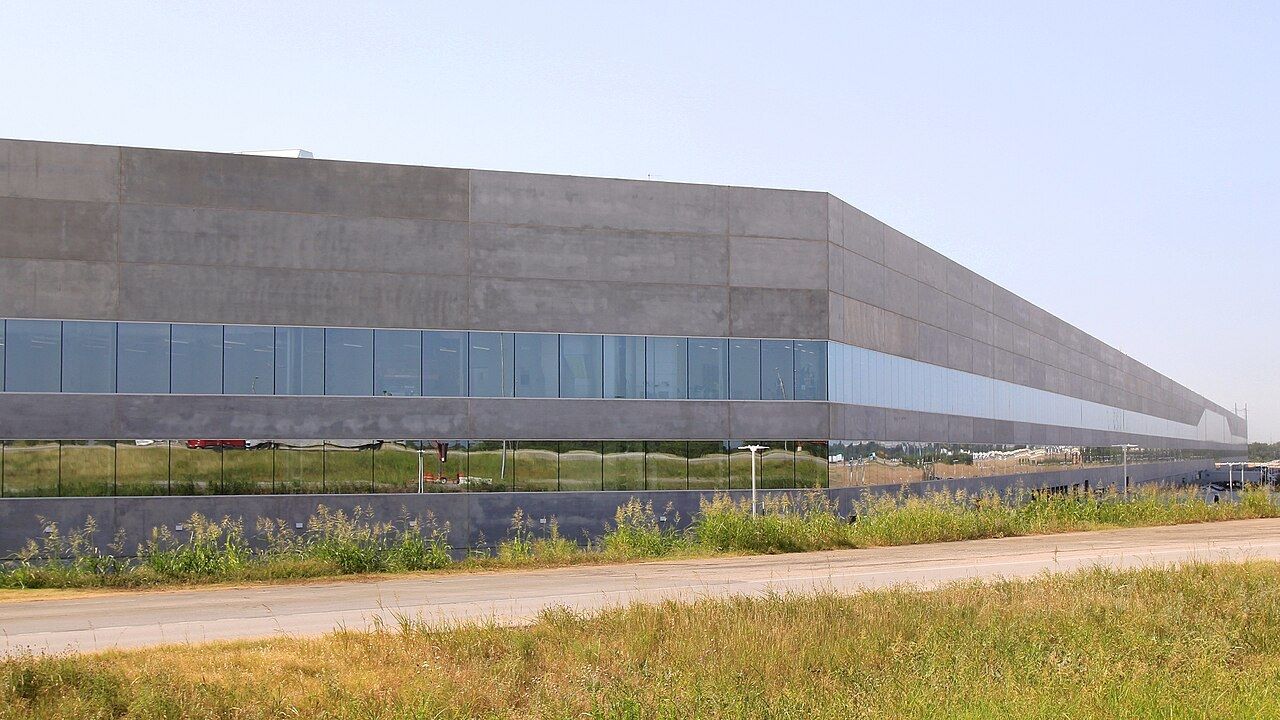 Tesla $94.8B2025
 - 26
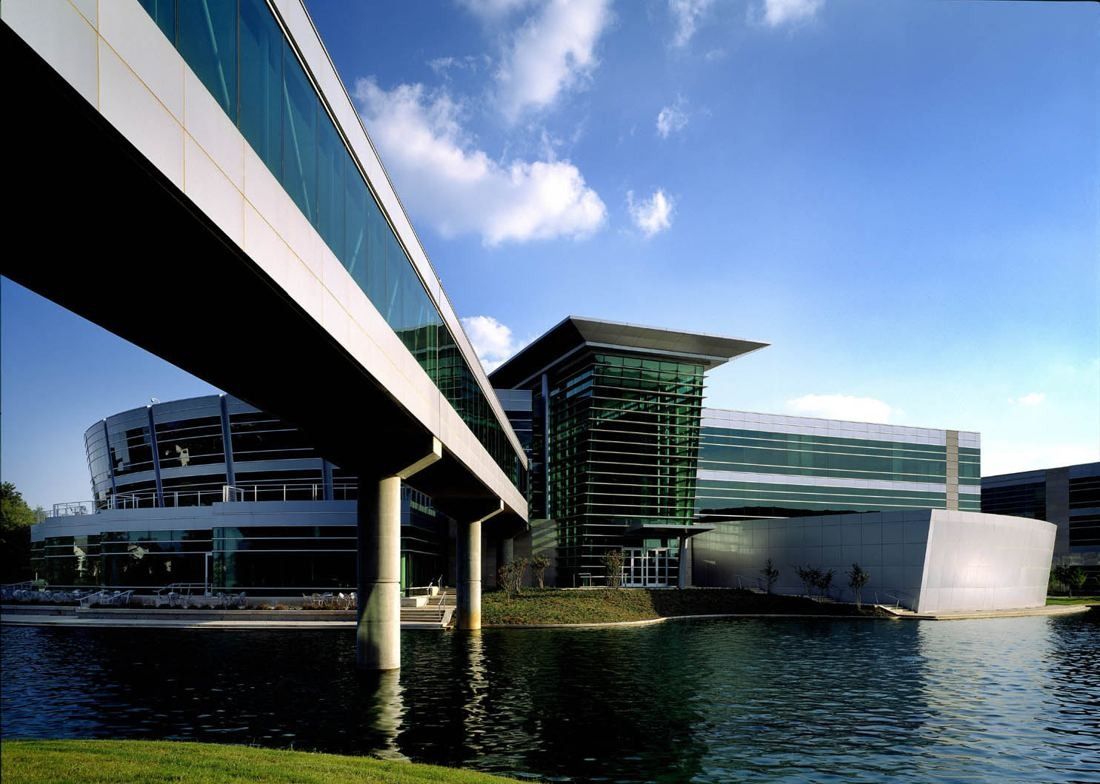 FedEx $94.7BFY2026
 - 27
 The Walt Disney Company $94.4BFY2025
 - 28
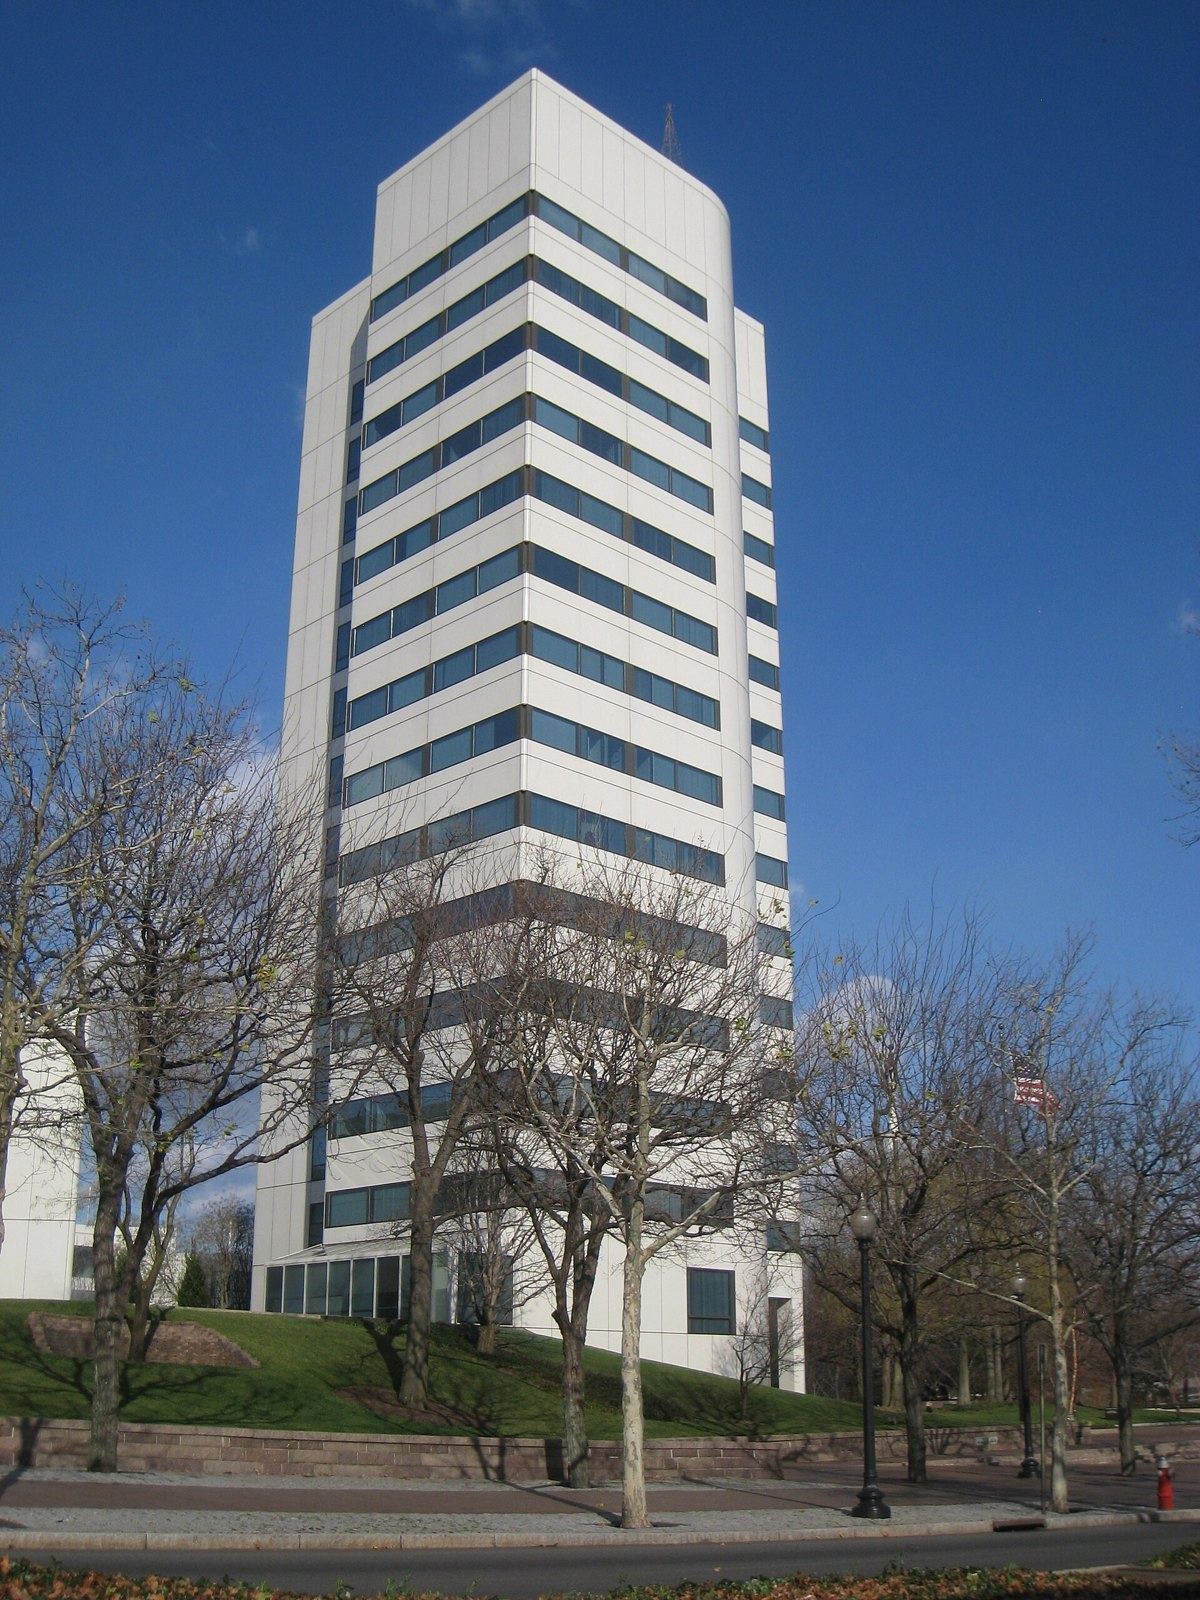 Johnson & Johnson $94.2BFY2025
 - 29
 PepsiCo $93.9BFY2025
 - 30
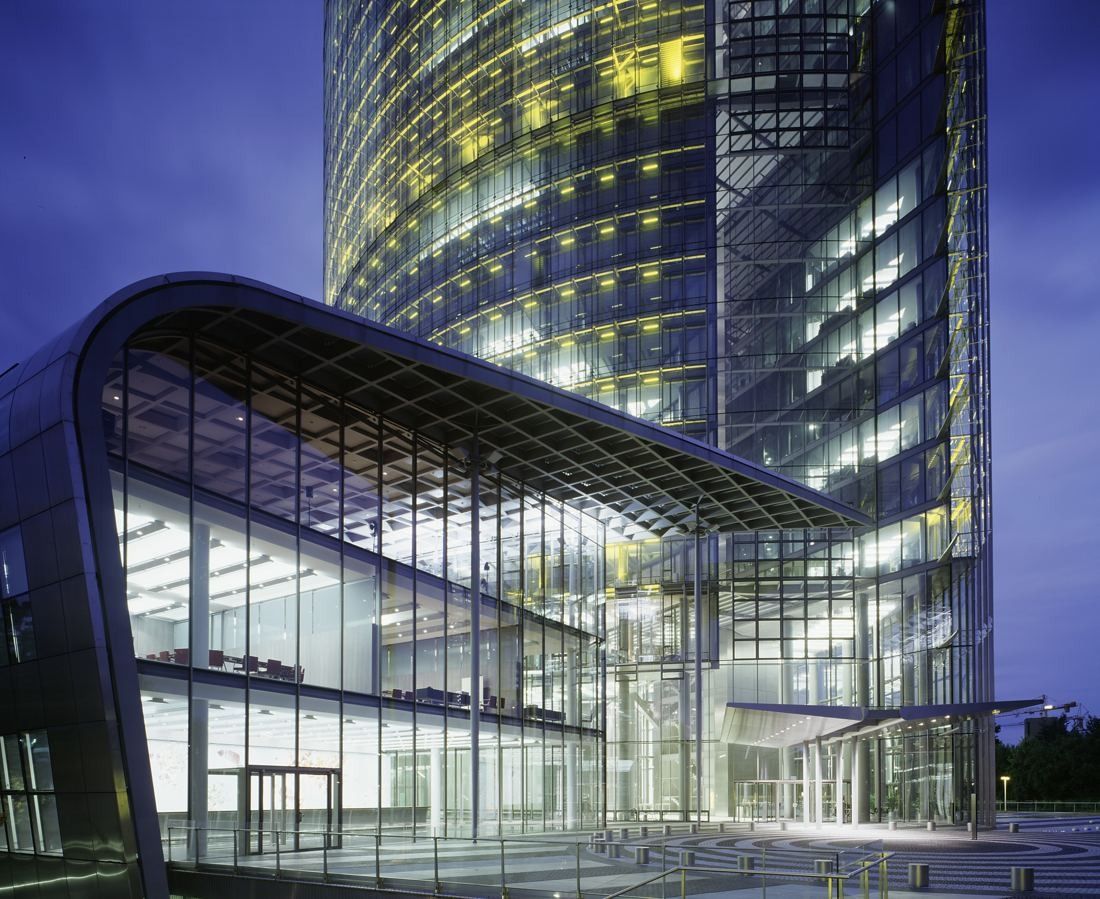 DHL Group $93.7B2025
 - 31
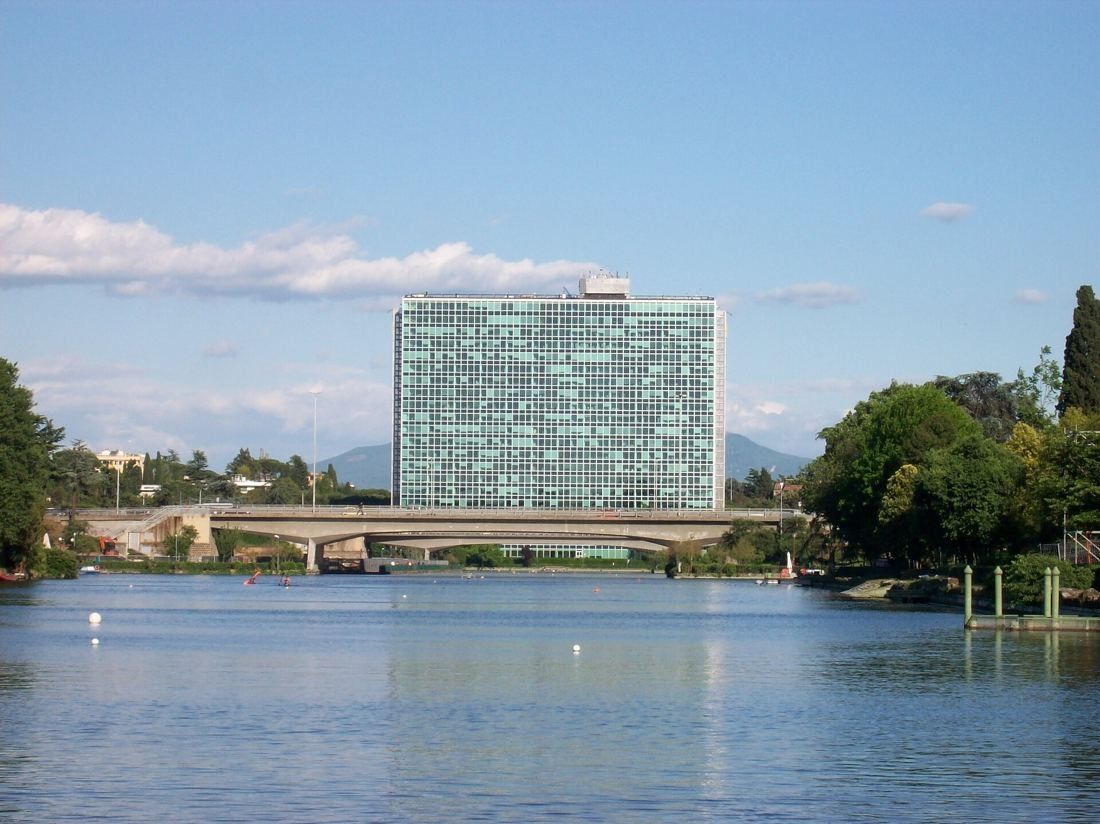 Eni $92.8B2025
 - 32
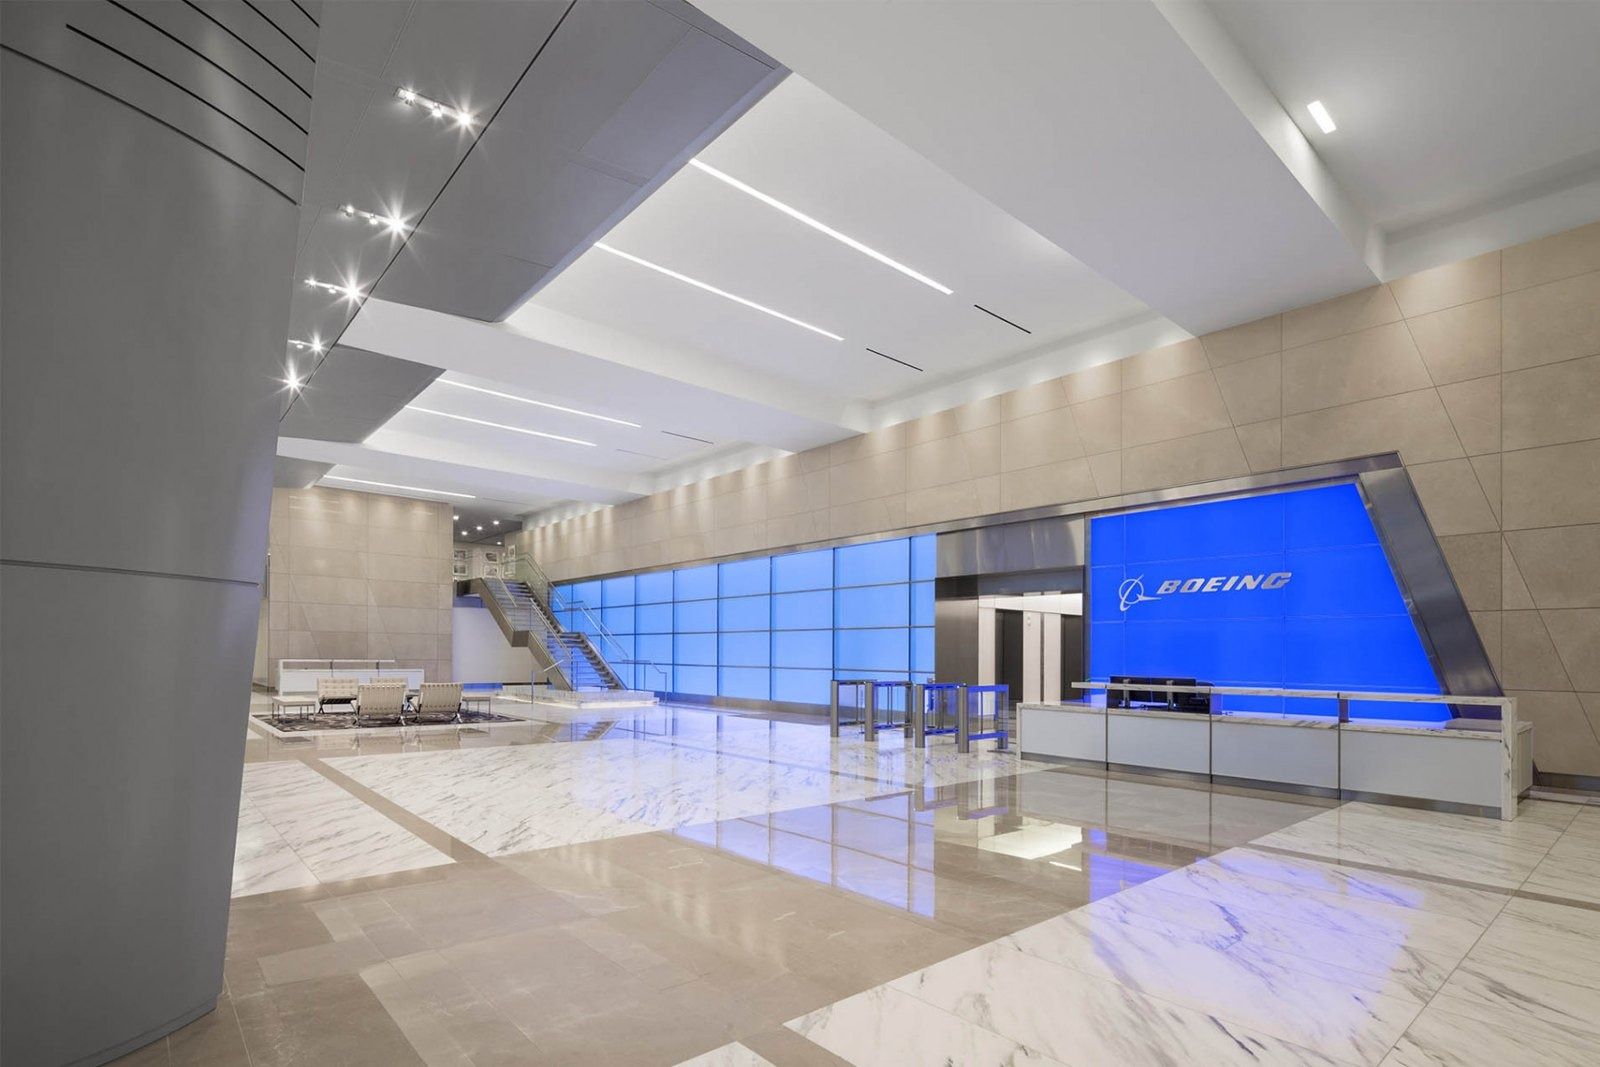 Boeing $89.5BFY2025
 - 33
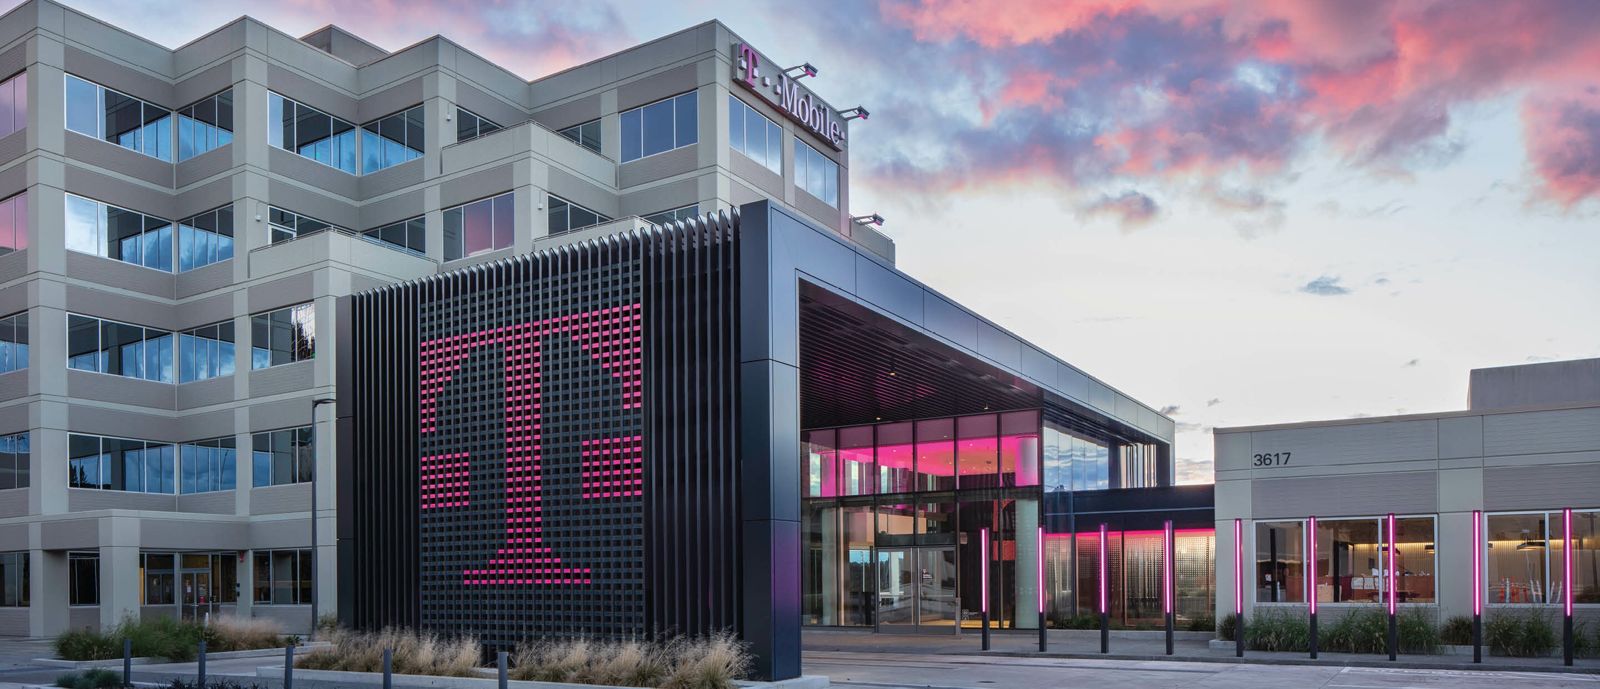 T-Mobile US $88.3BFY2025
 - 34
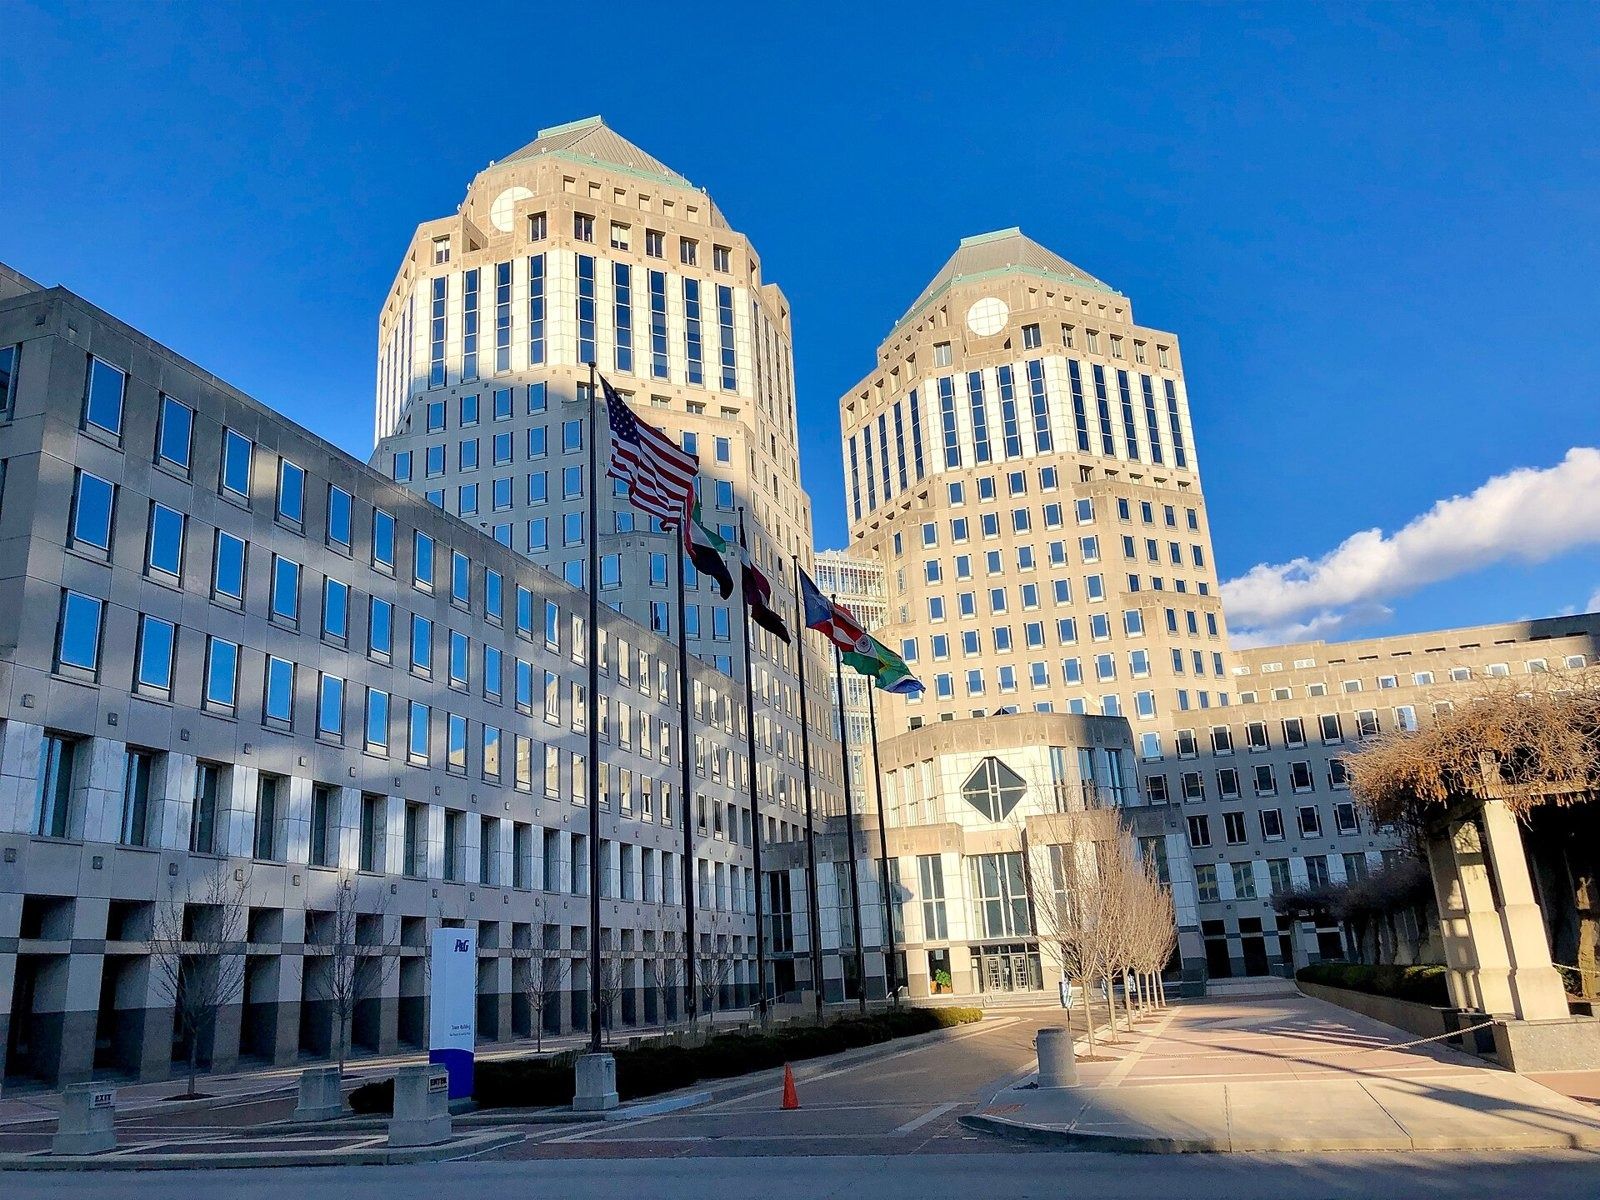 Procter & Gamble $87.0BFY2026
 - 35
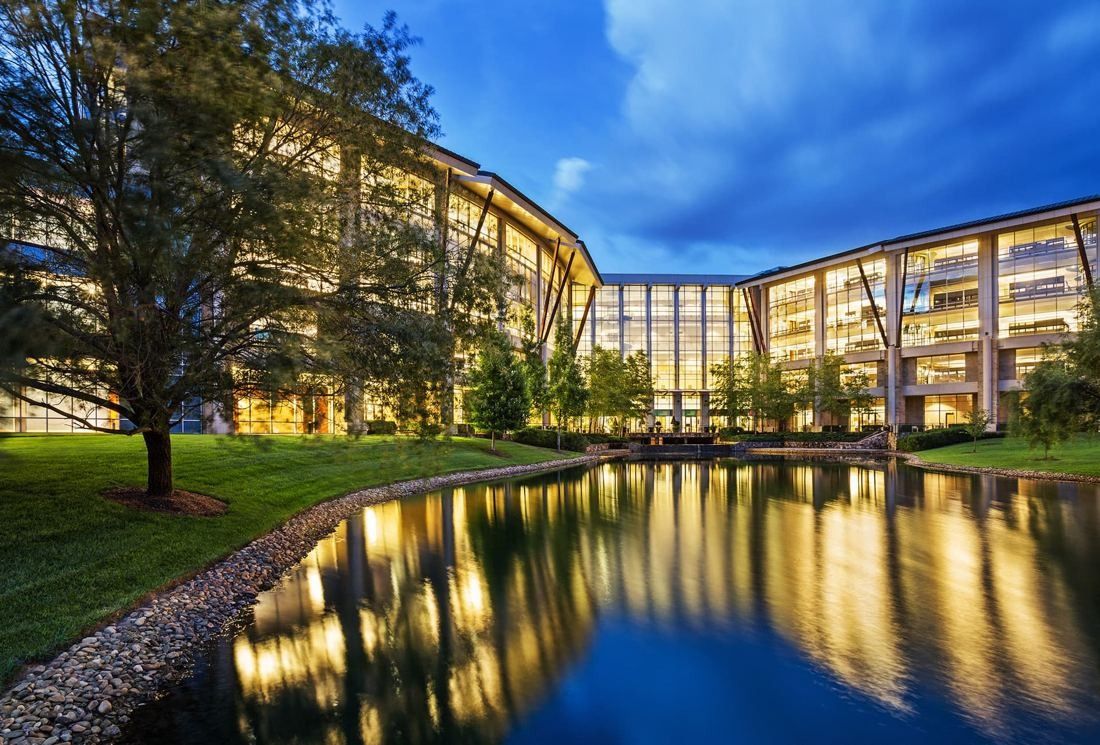 Lowe's $86.3BFY2025
 - 36
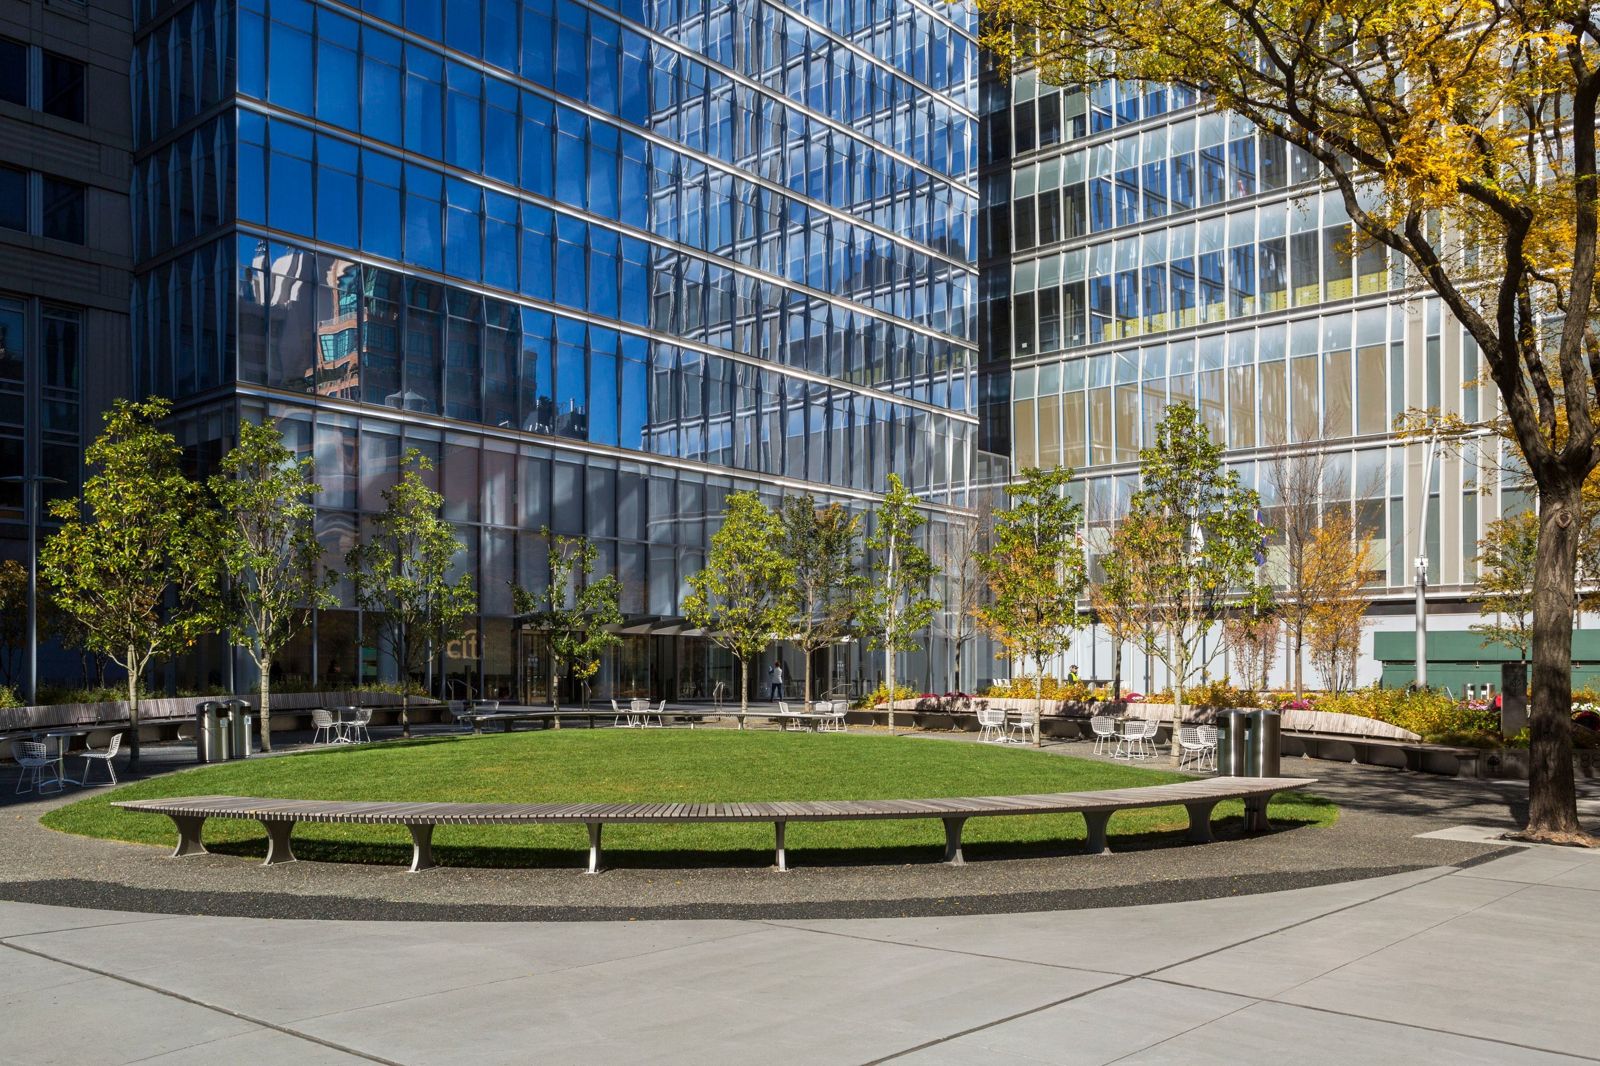 Citigroup $85.2BFY2025
 - 37
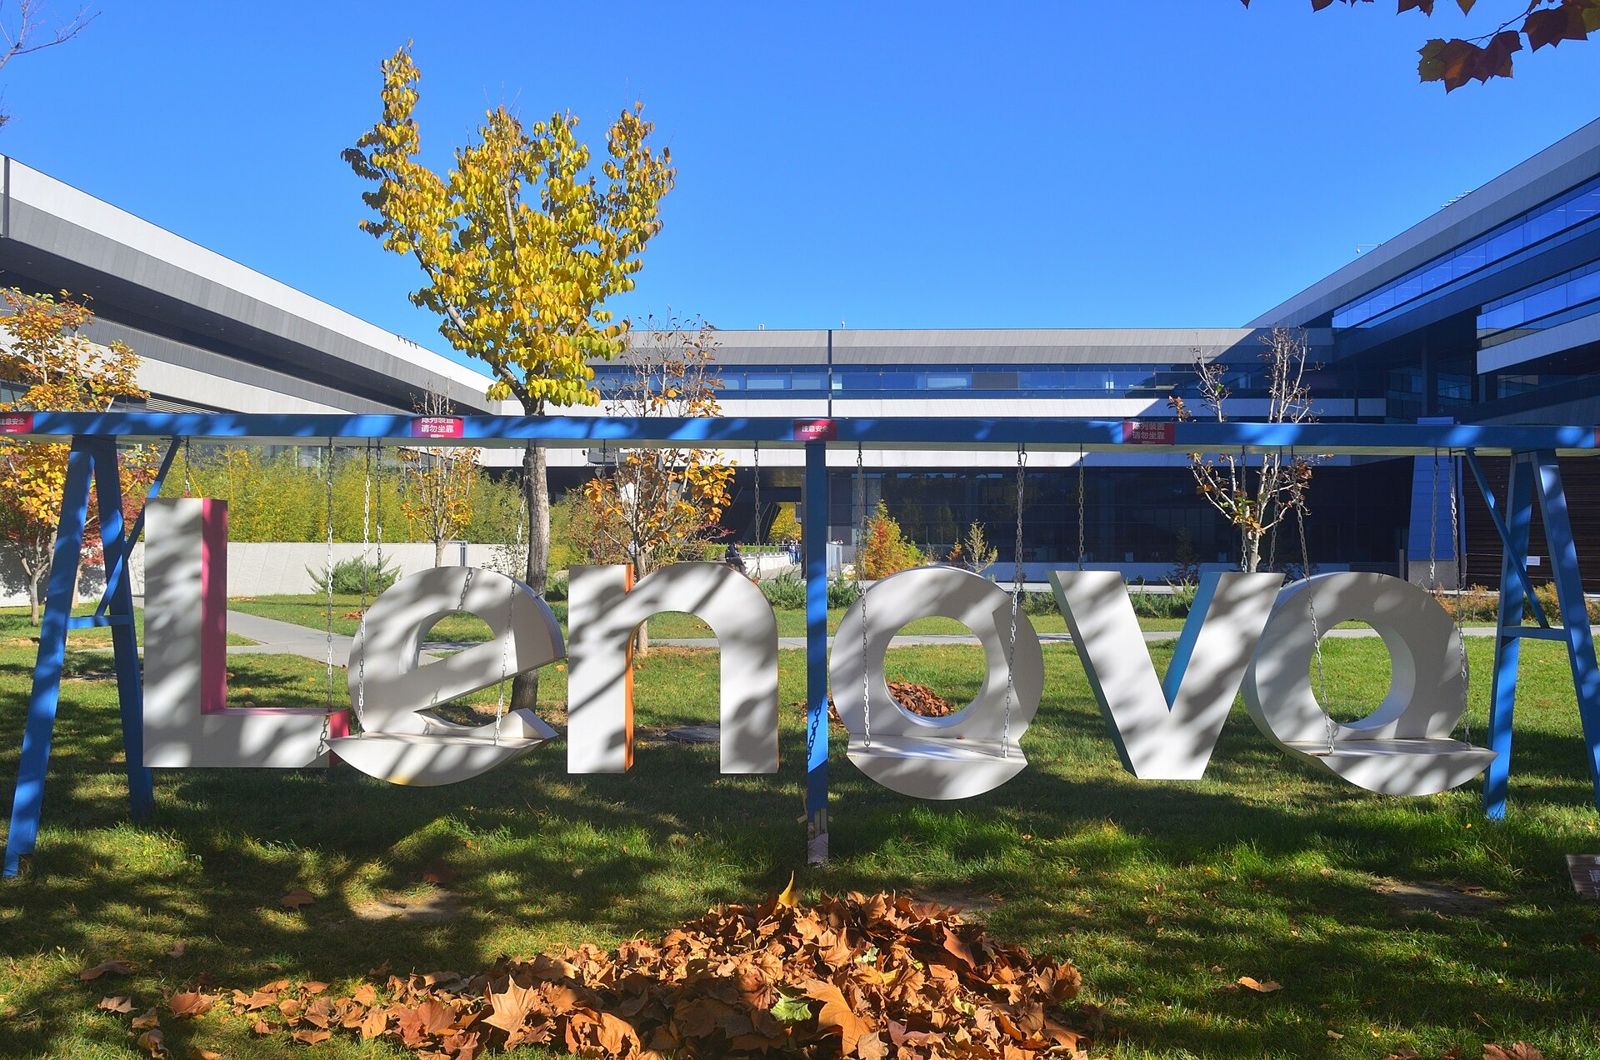 Lenovo $83.1B2025/26
 - 38
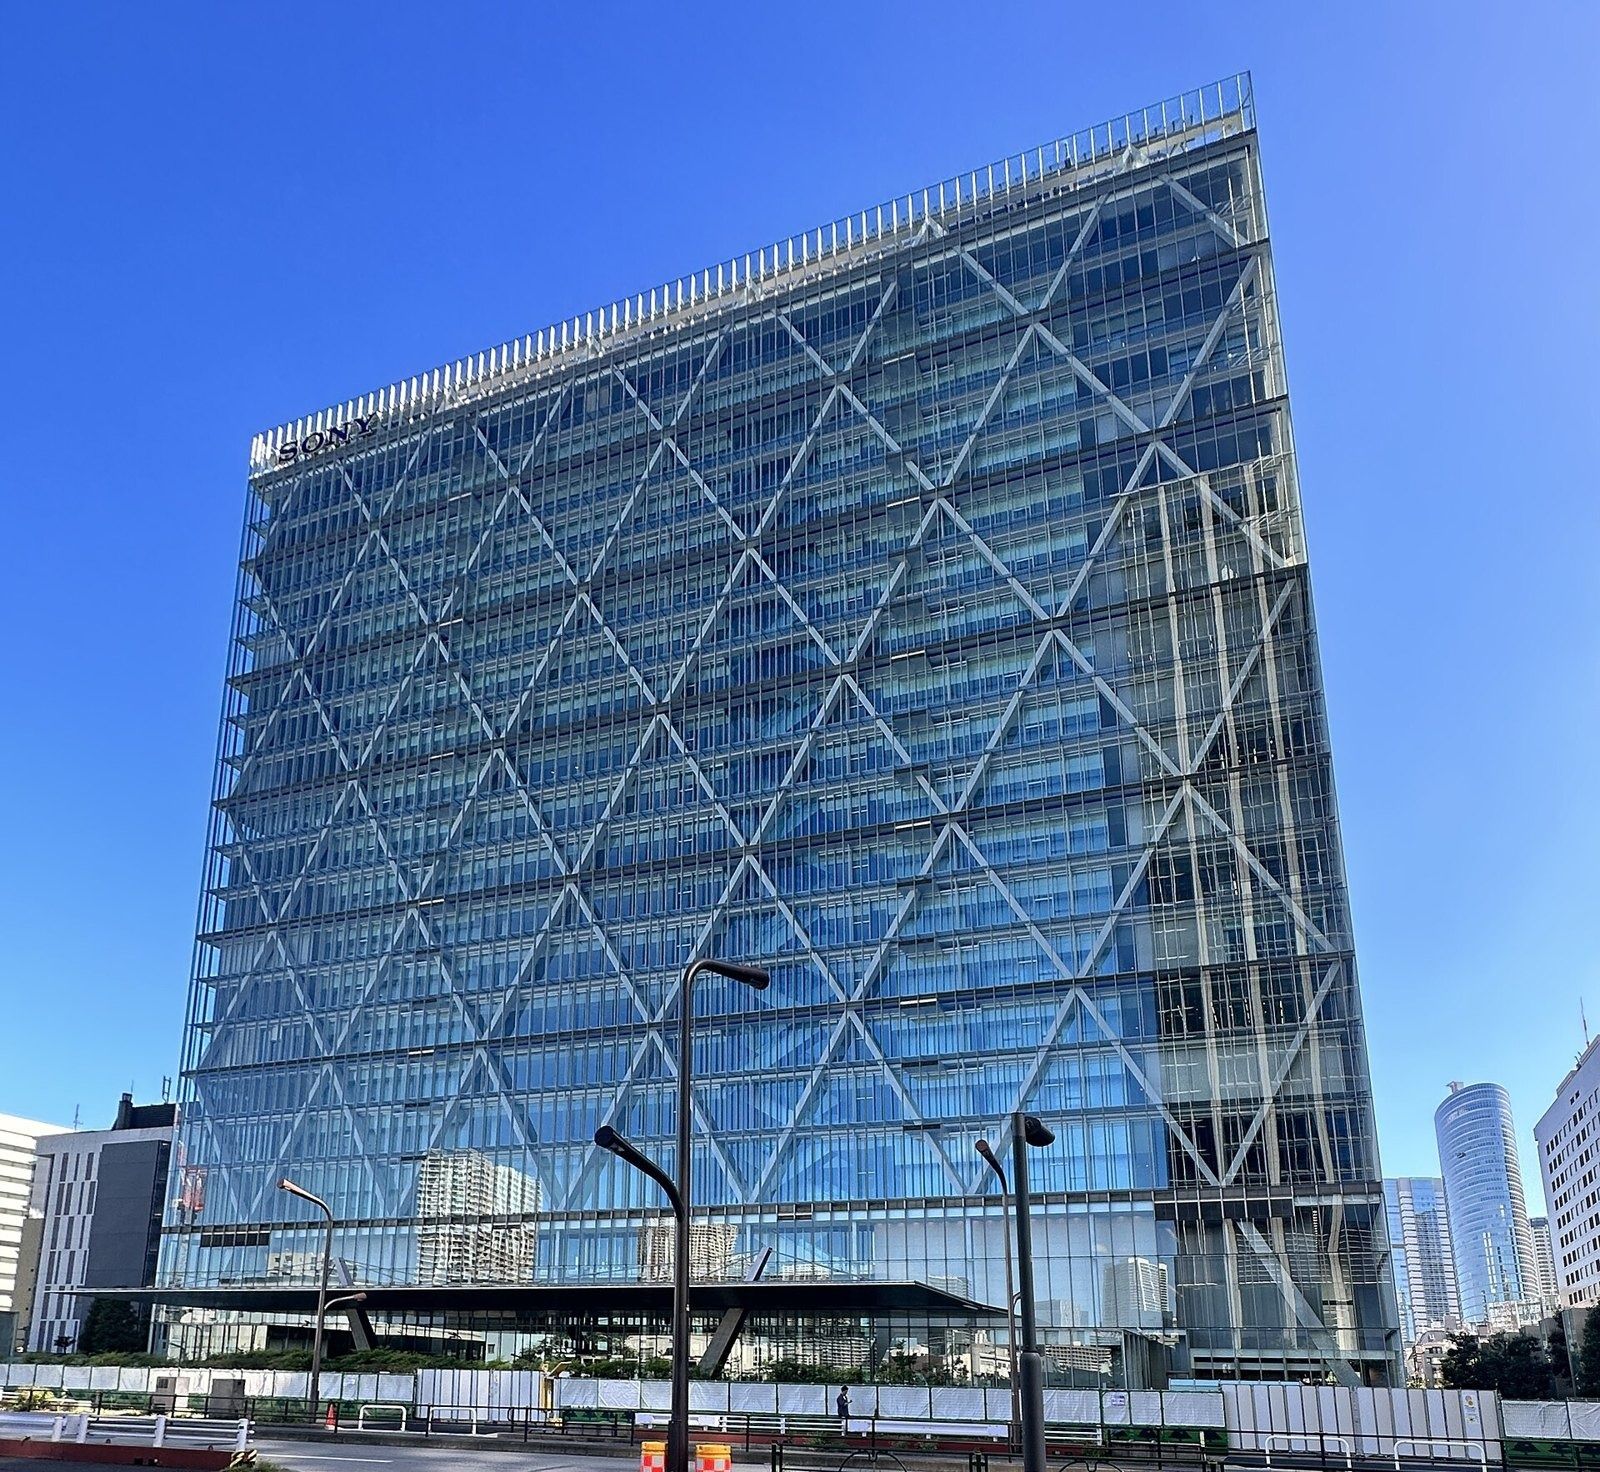 Sony Group ≈$82.8BFY ended Mar 2026
 - 39
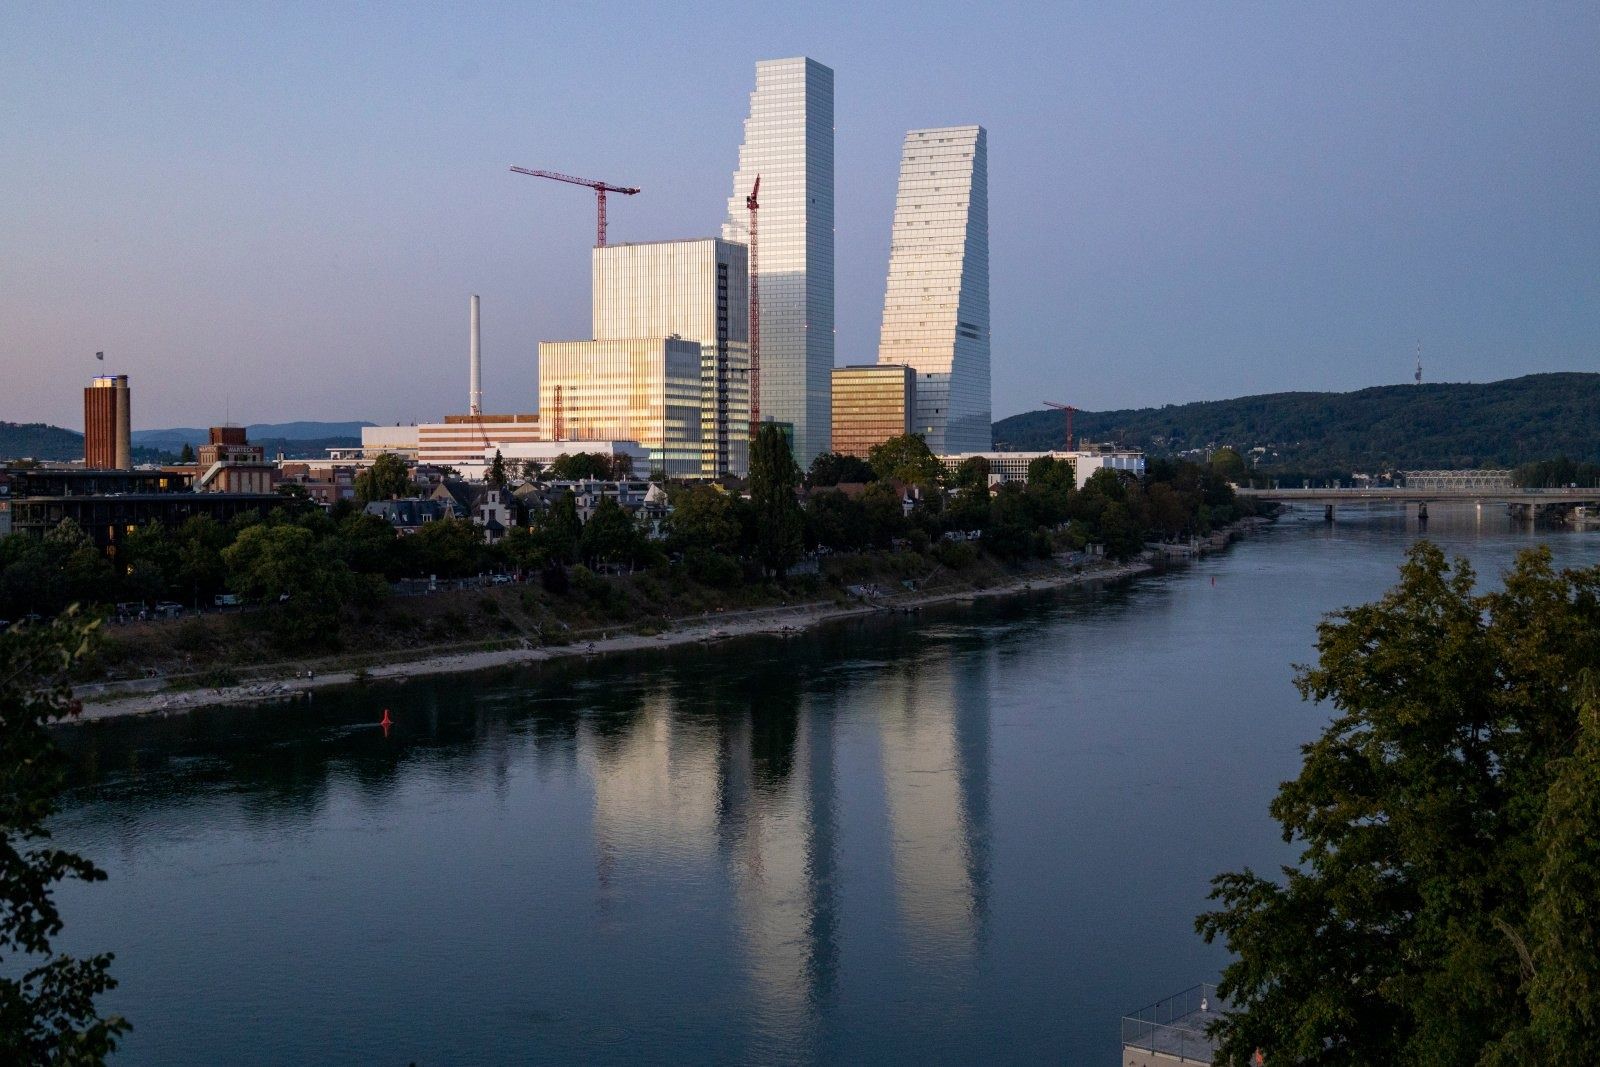 Roche ≈$74.1B2025
 - 40
 American Express $72.2B2025
 - 41
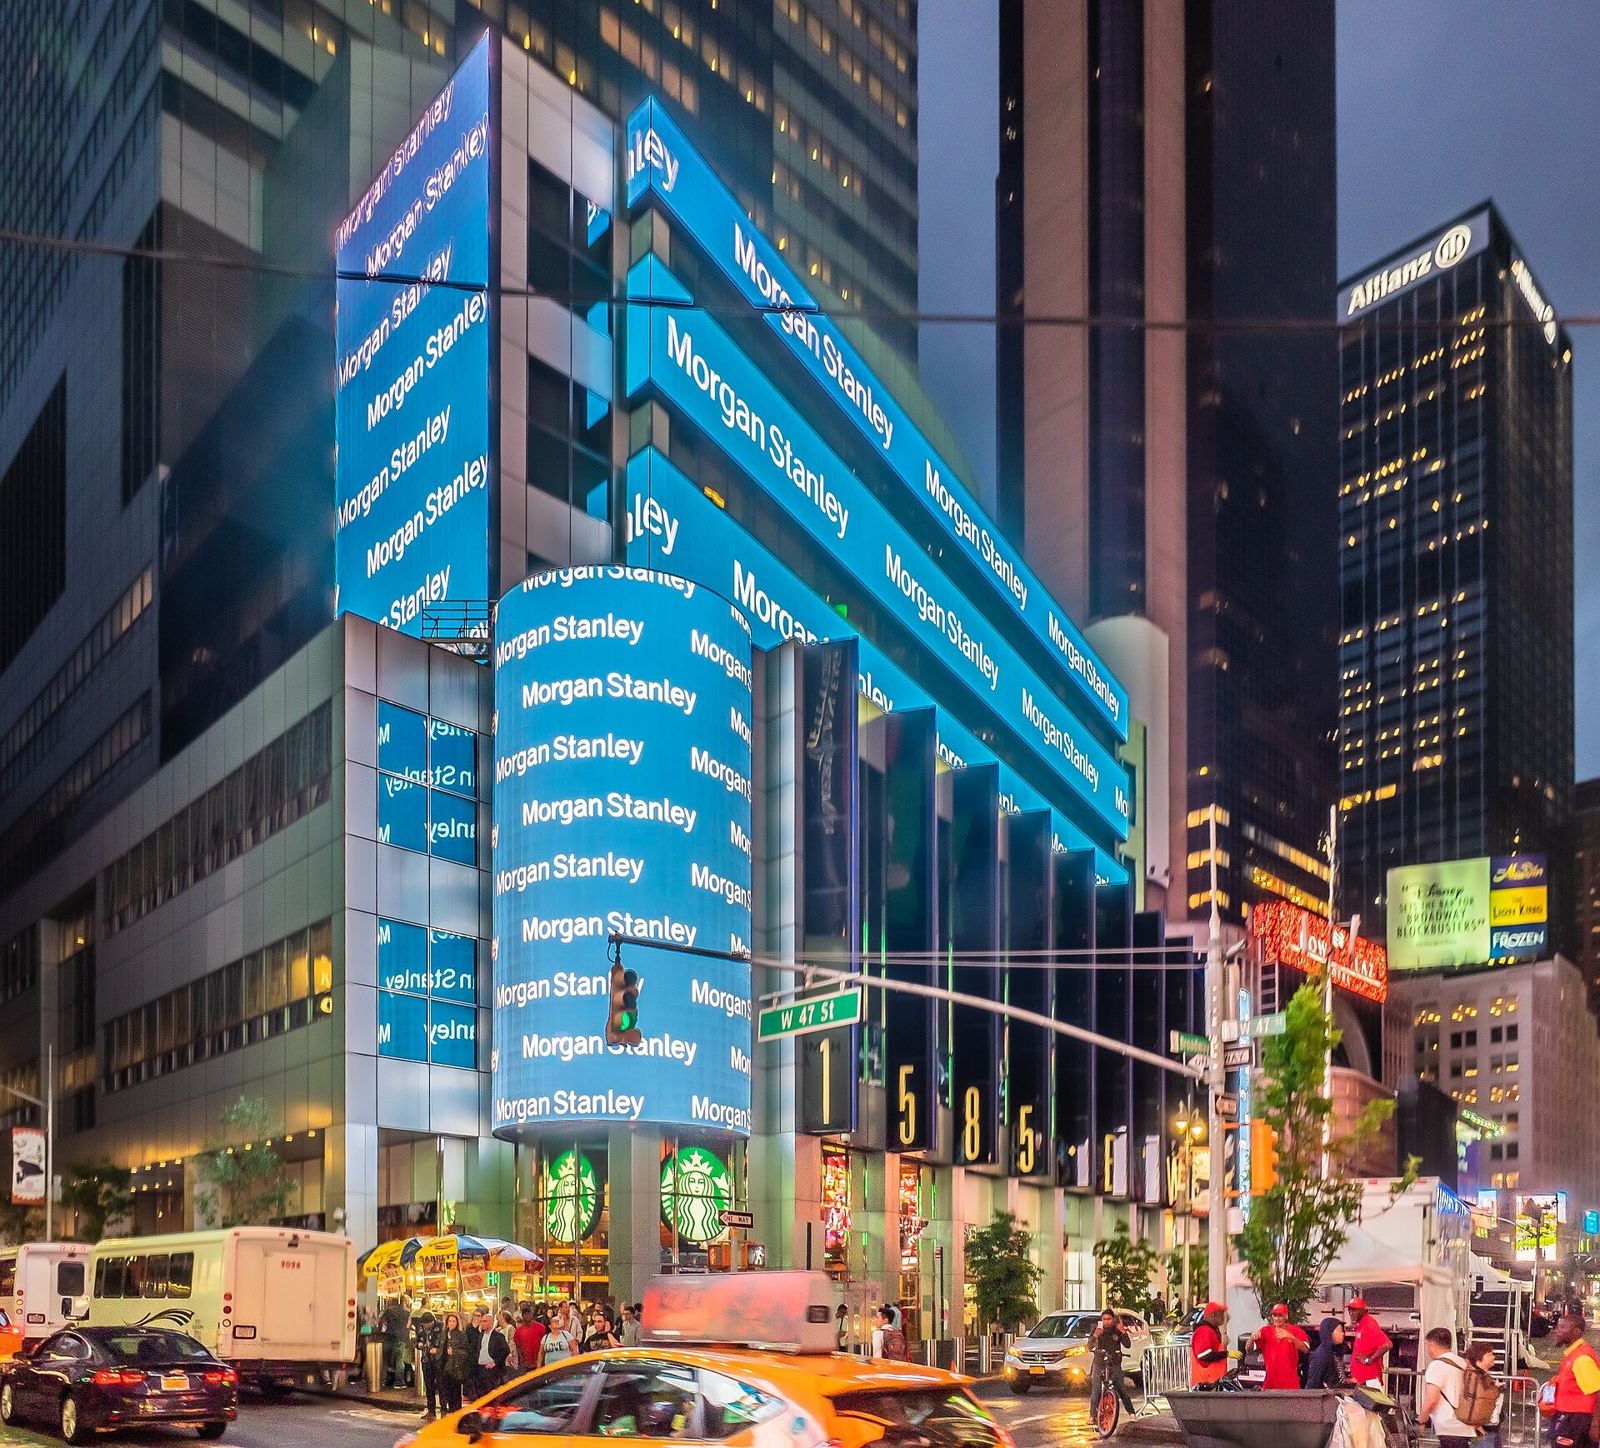 Morgan Stanley $70.6B2025
 - 42
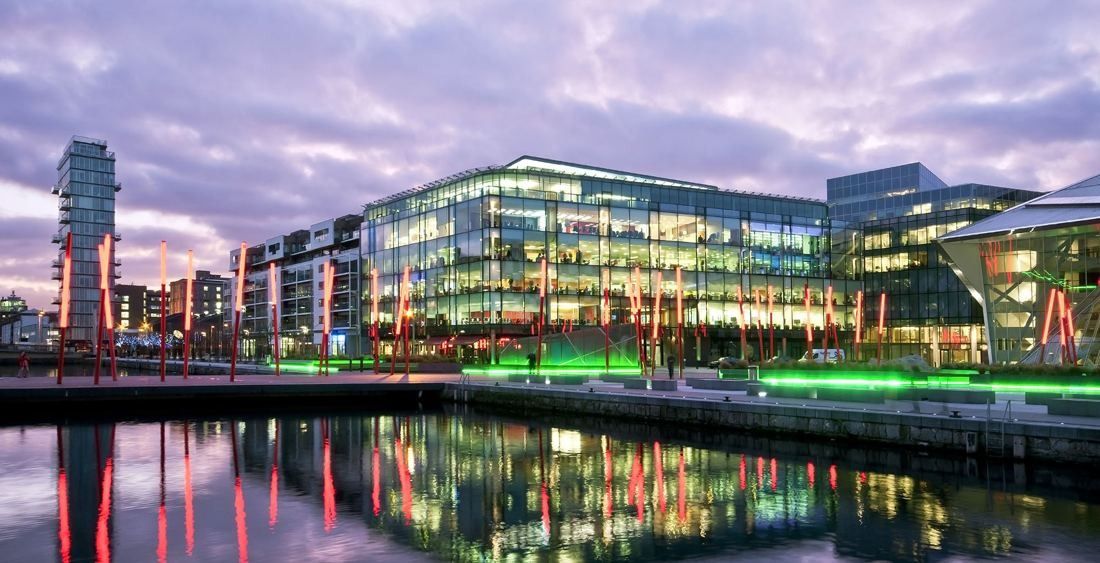 Accenture $69.7BFY2025
 - 43
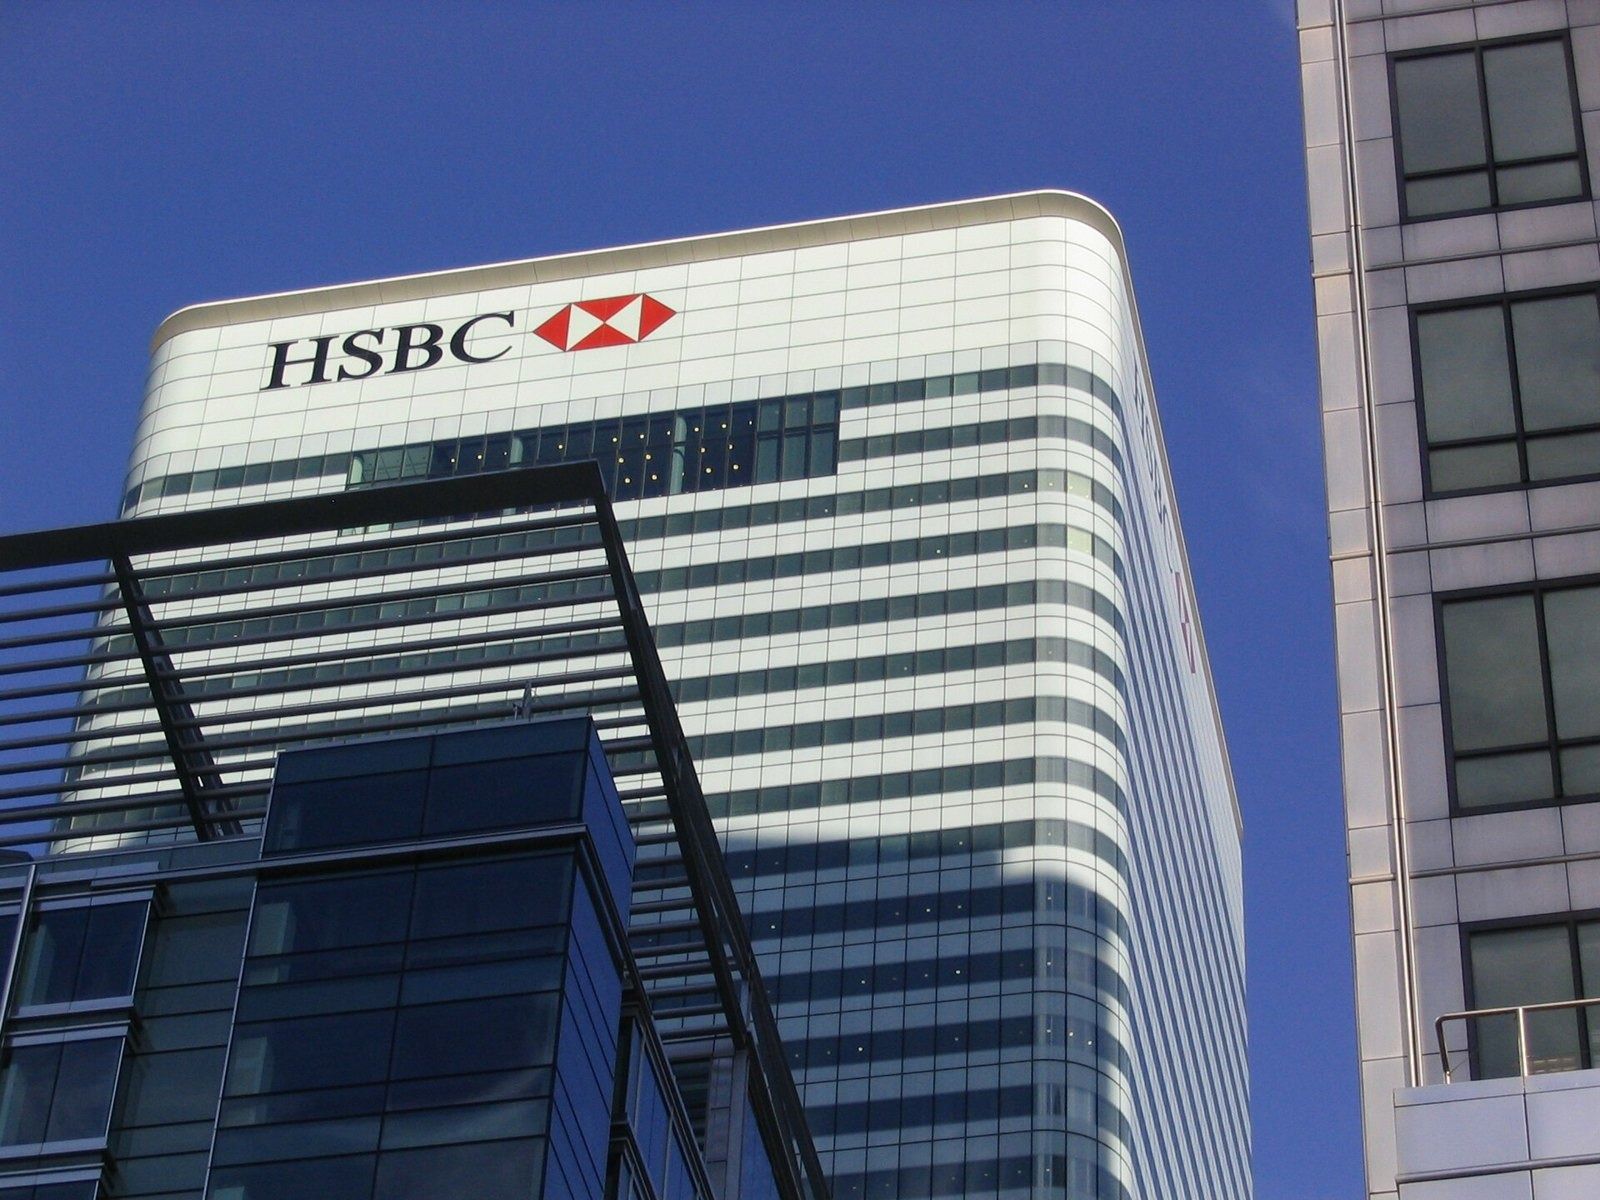 HSBC $68.3B2025
 - 44
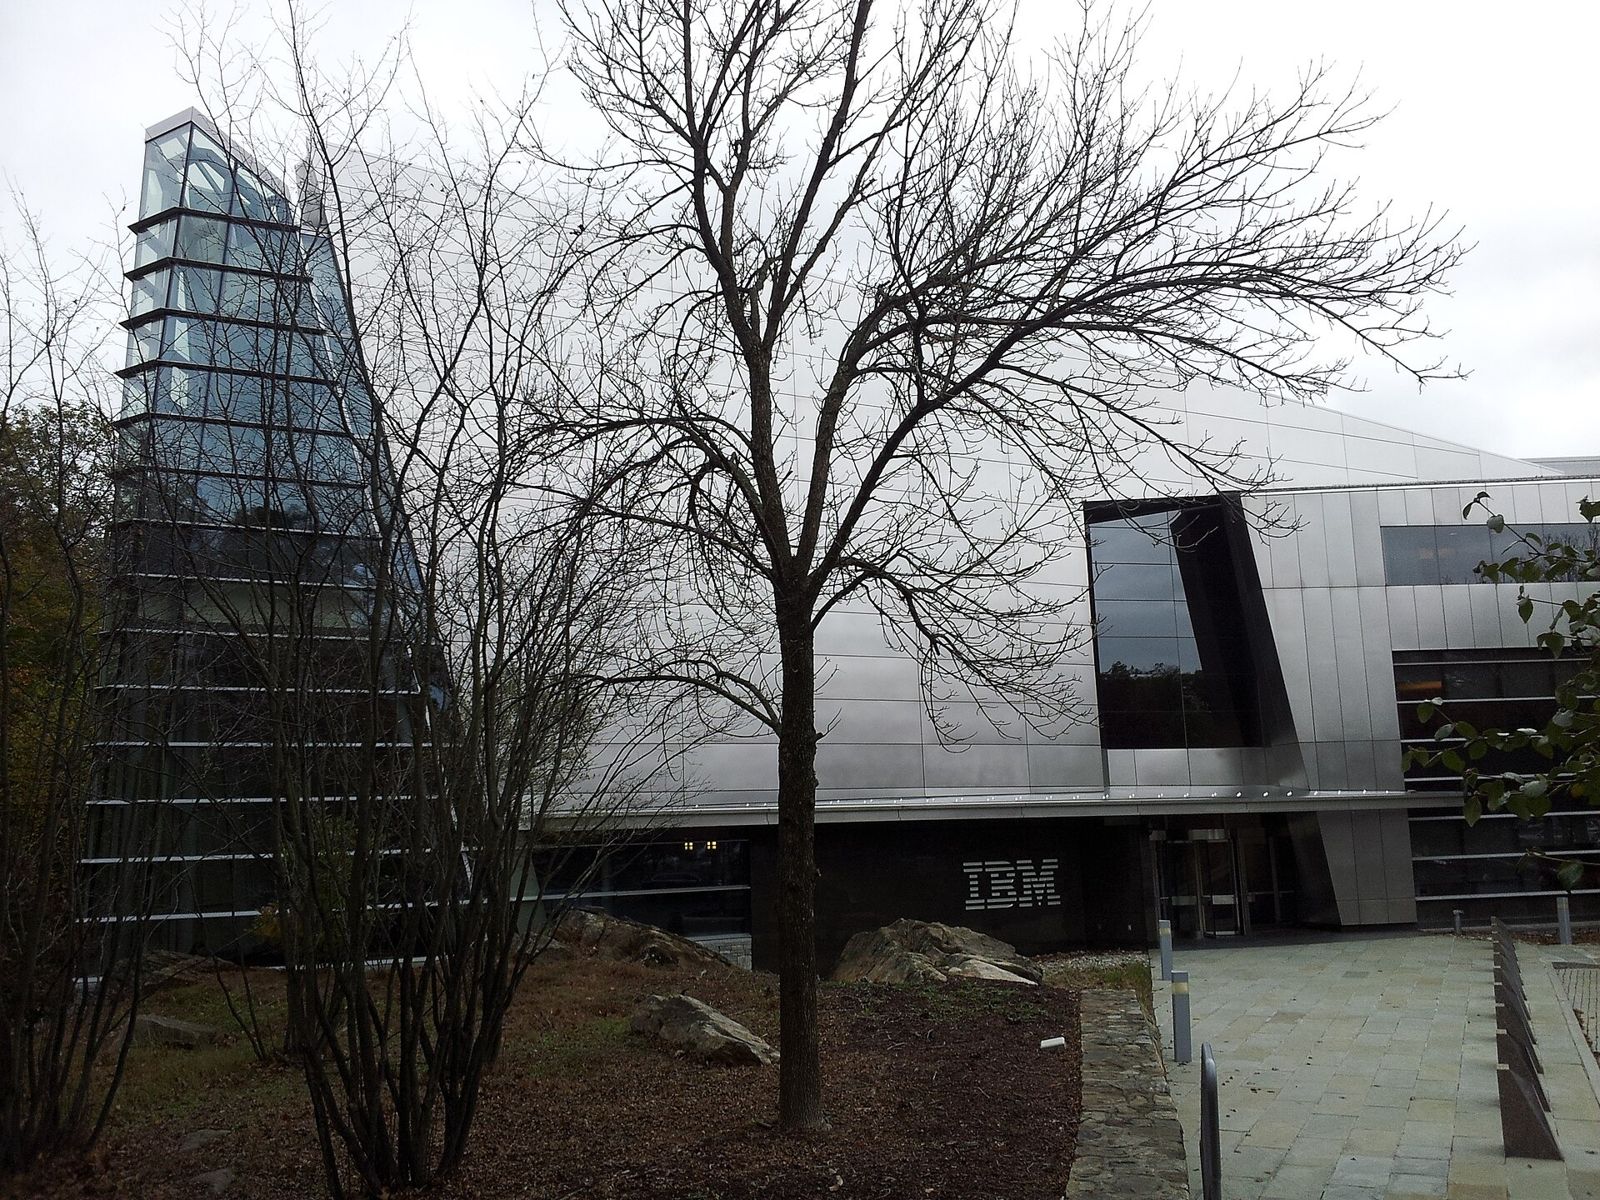 IBM $67.5B2025
 - 45
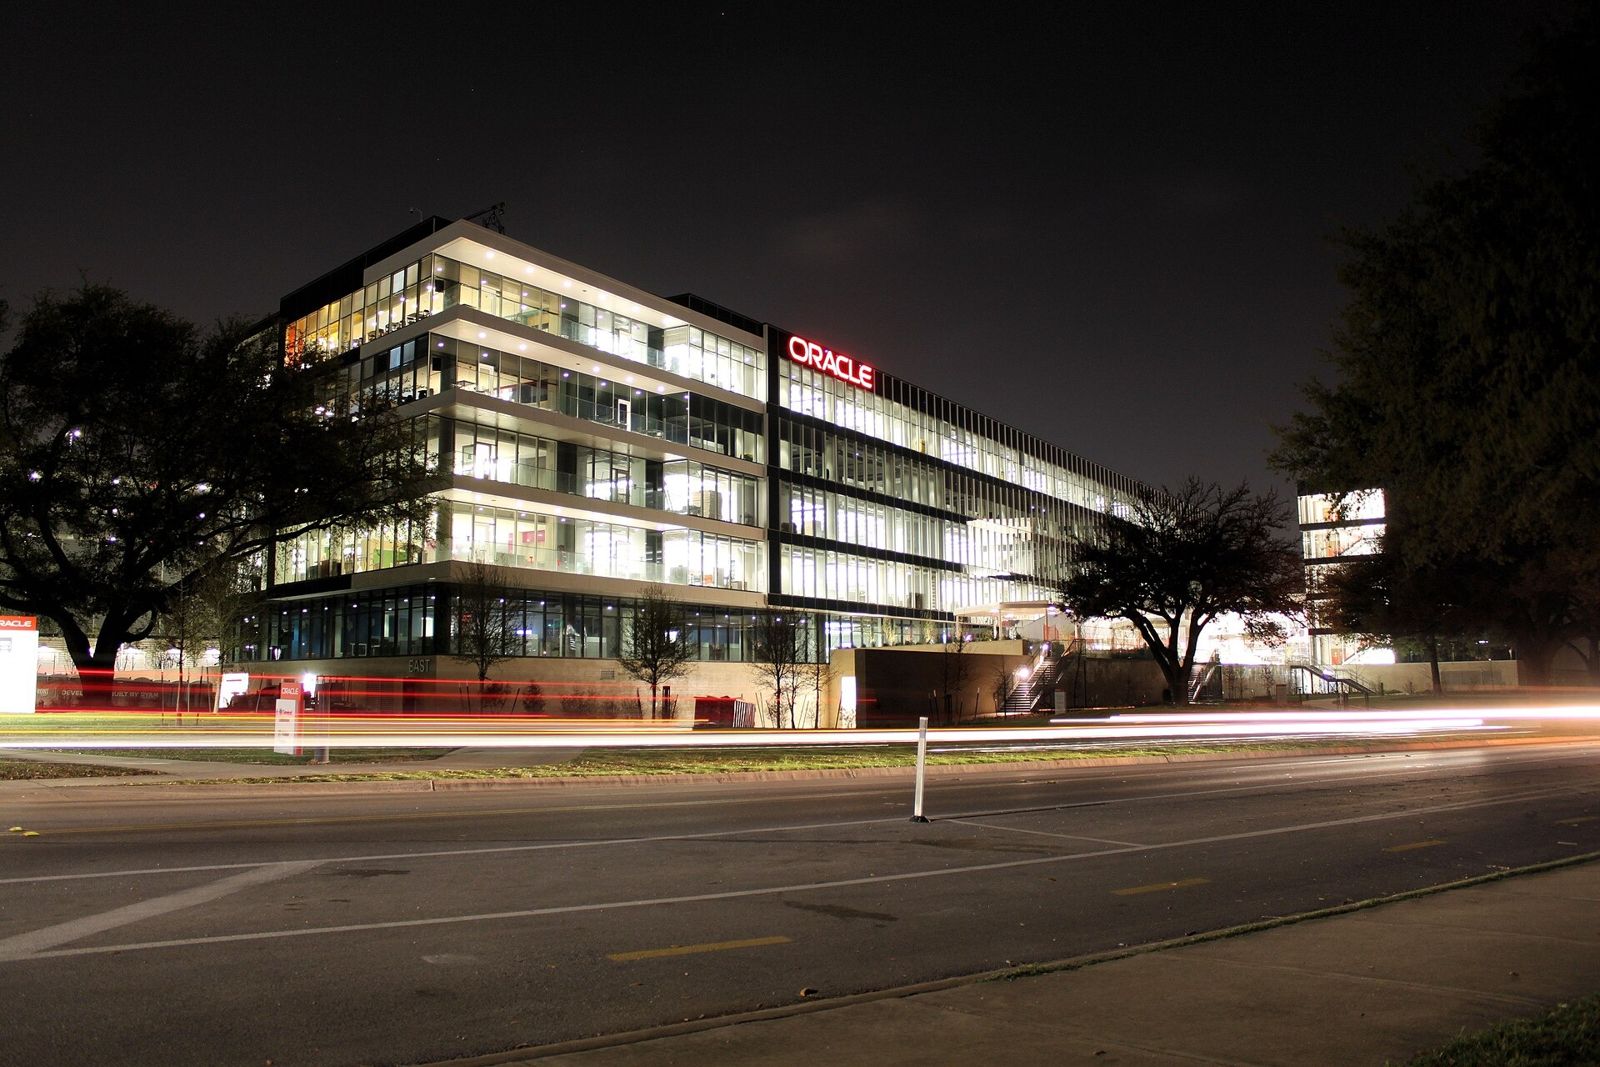 Oracle $67.4BFY2026
 - 46
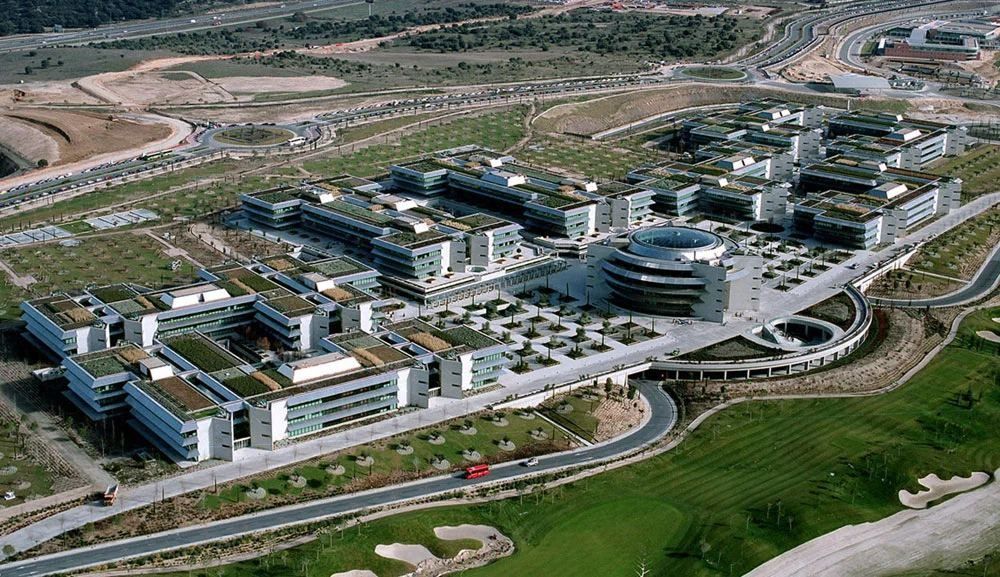 Banco Santander ≈$66.2B2025
 - 47
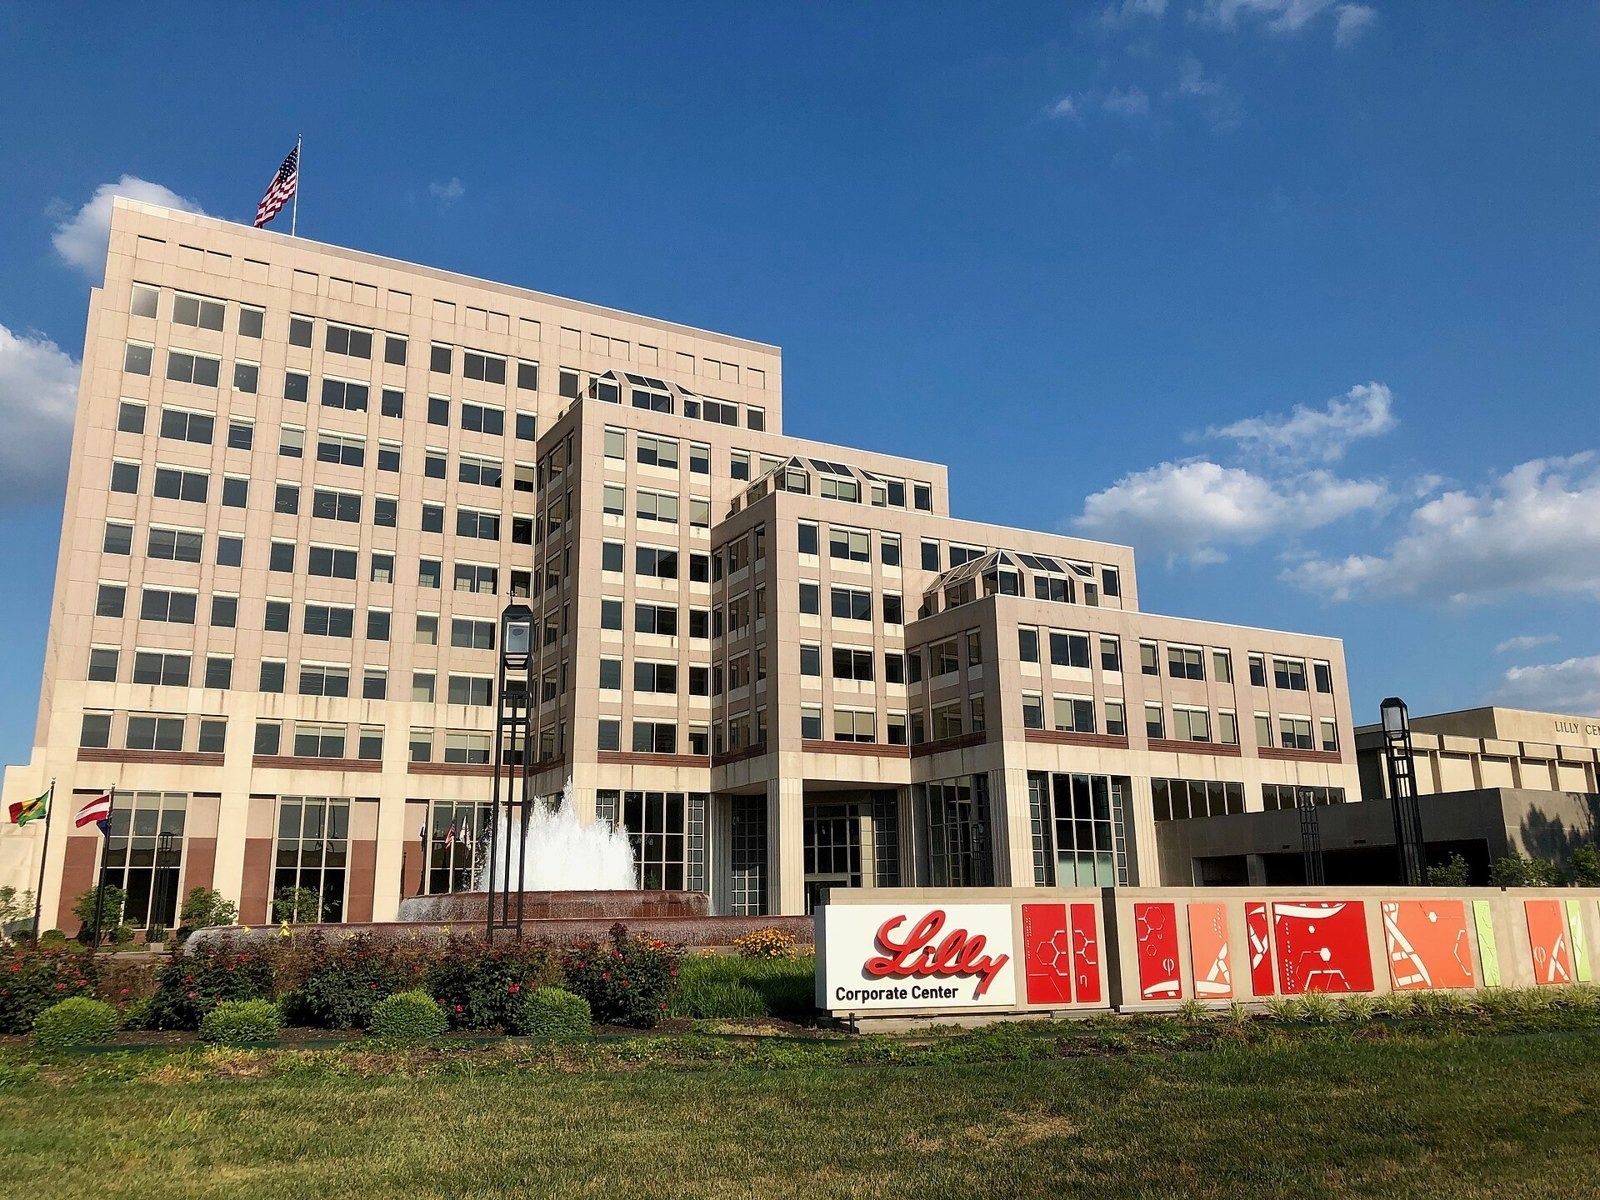 Eli Lilly and Company $65.2BFY2025
 - 48
 Broadcom $63.9BFY2025
 - 49
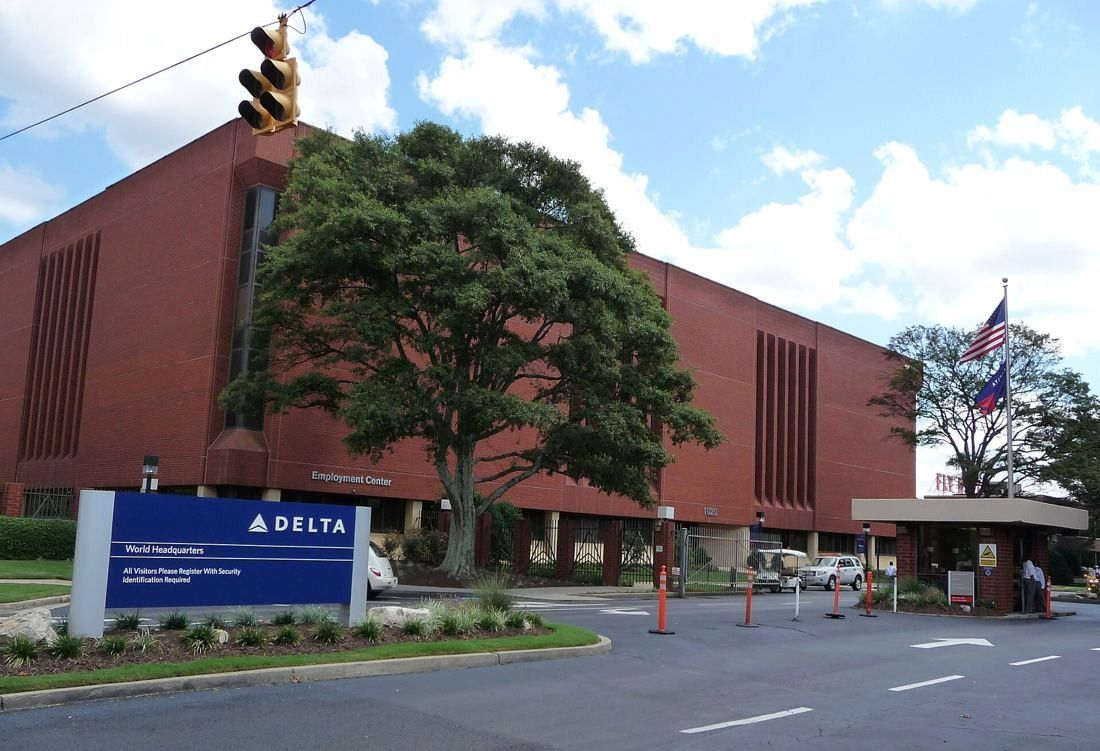 Delta Air Lines $63.4B2025
 - 50
 Pfizer $62.6BFY2025
 - 51
 United Airlines $59.1BFY2025
 - 52
 BHP $58.8BFY2026
 - 53
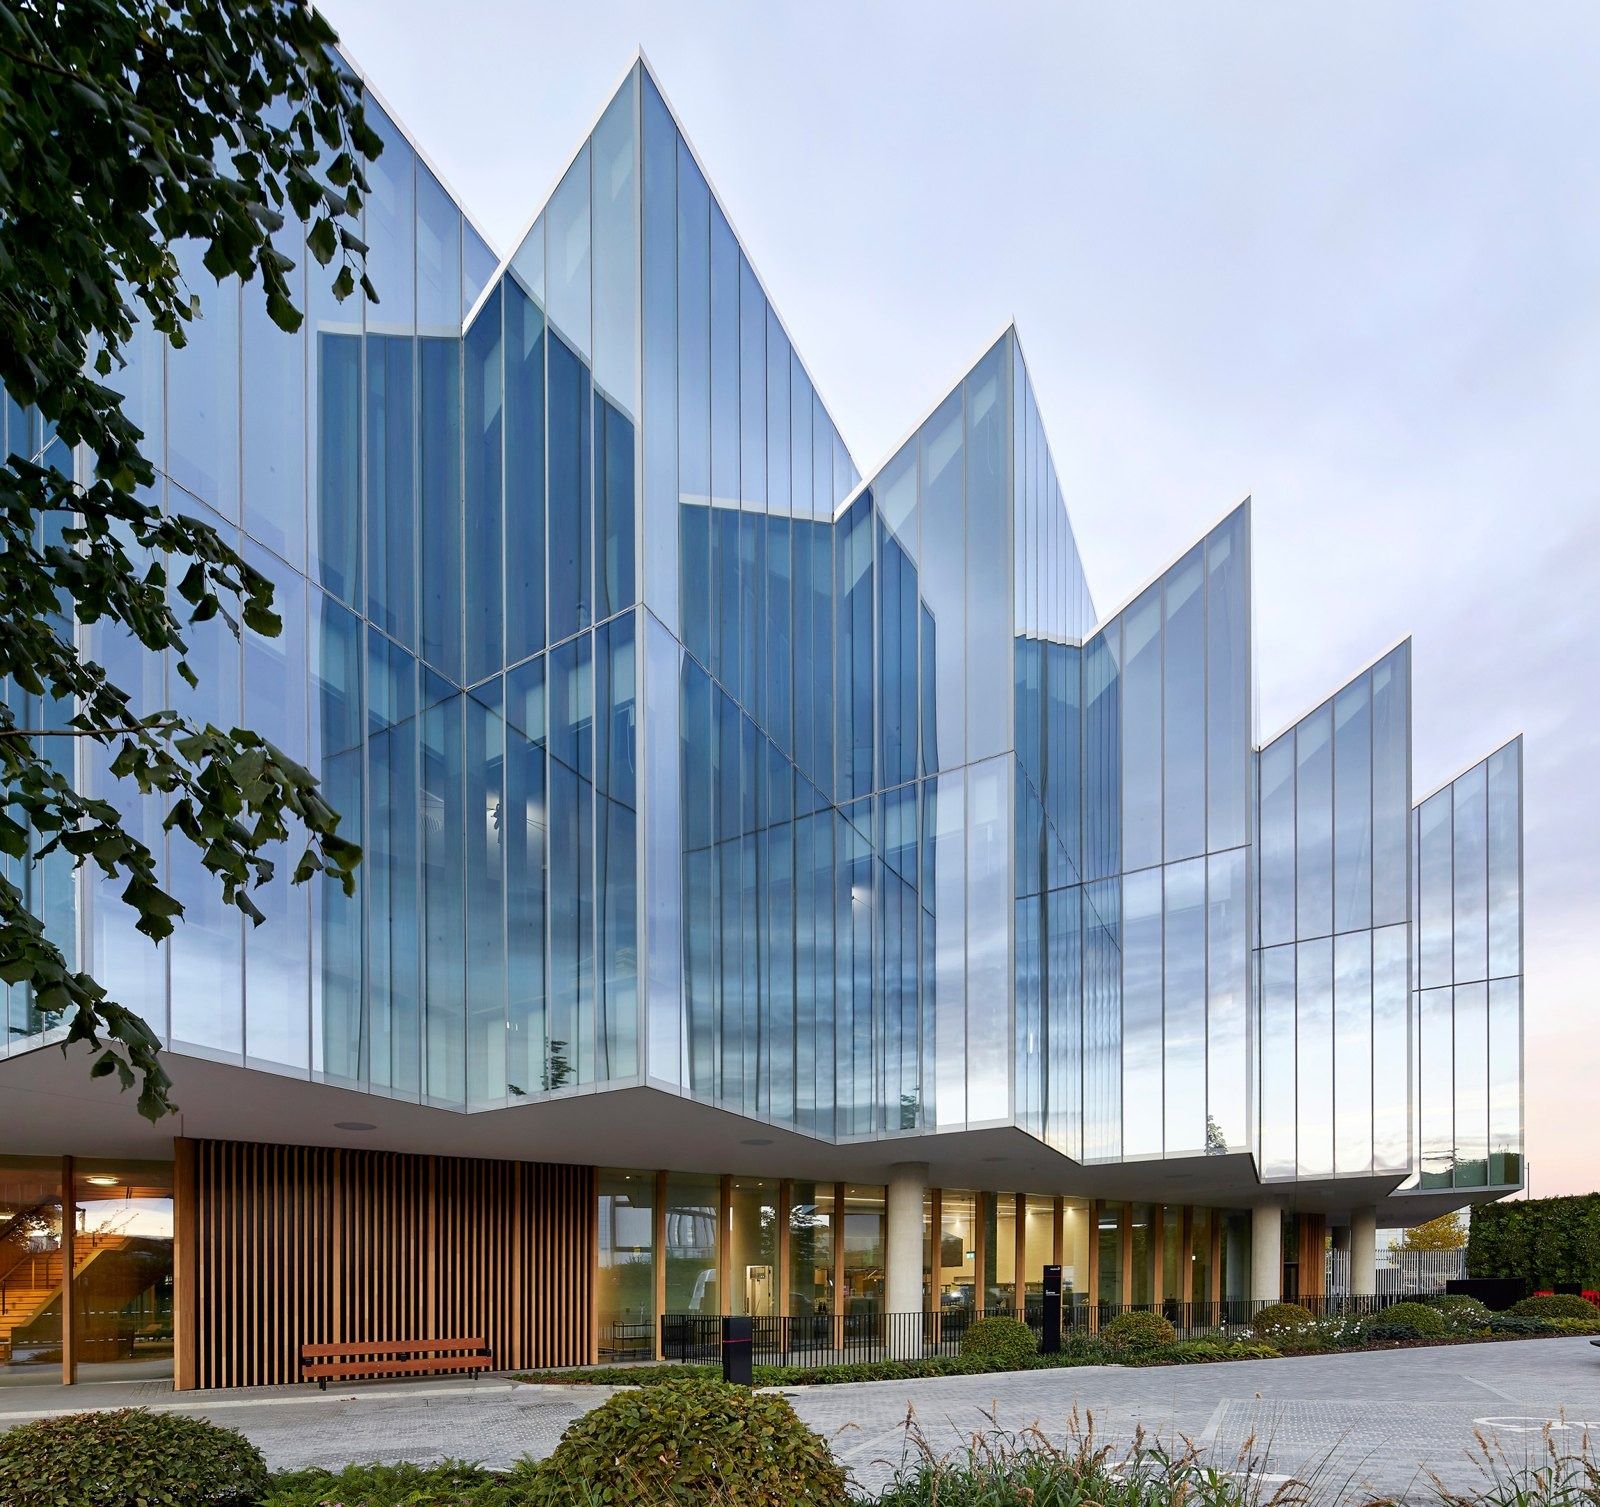 AstraZeneca $58.7B2025
 - 54
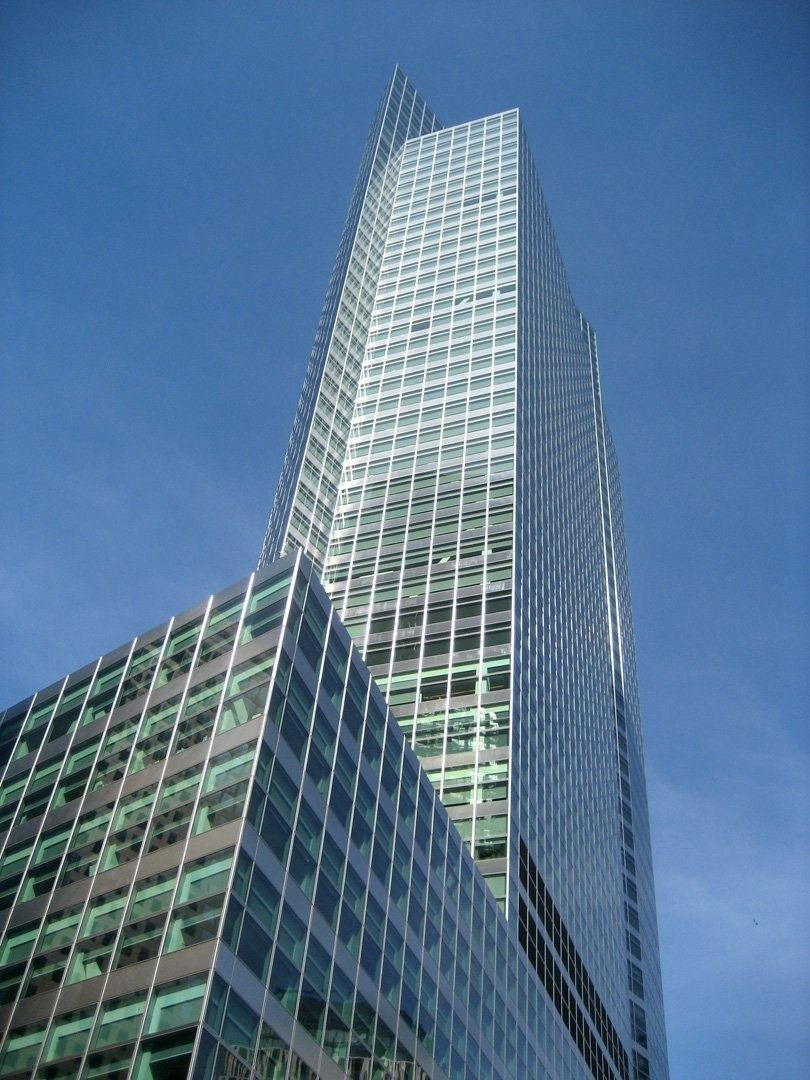 Goldman Sachs $58.3B2025
 - 55
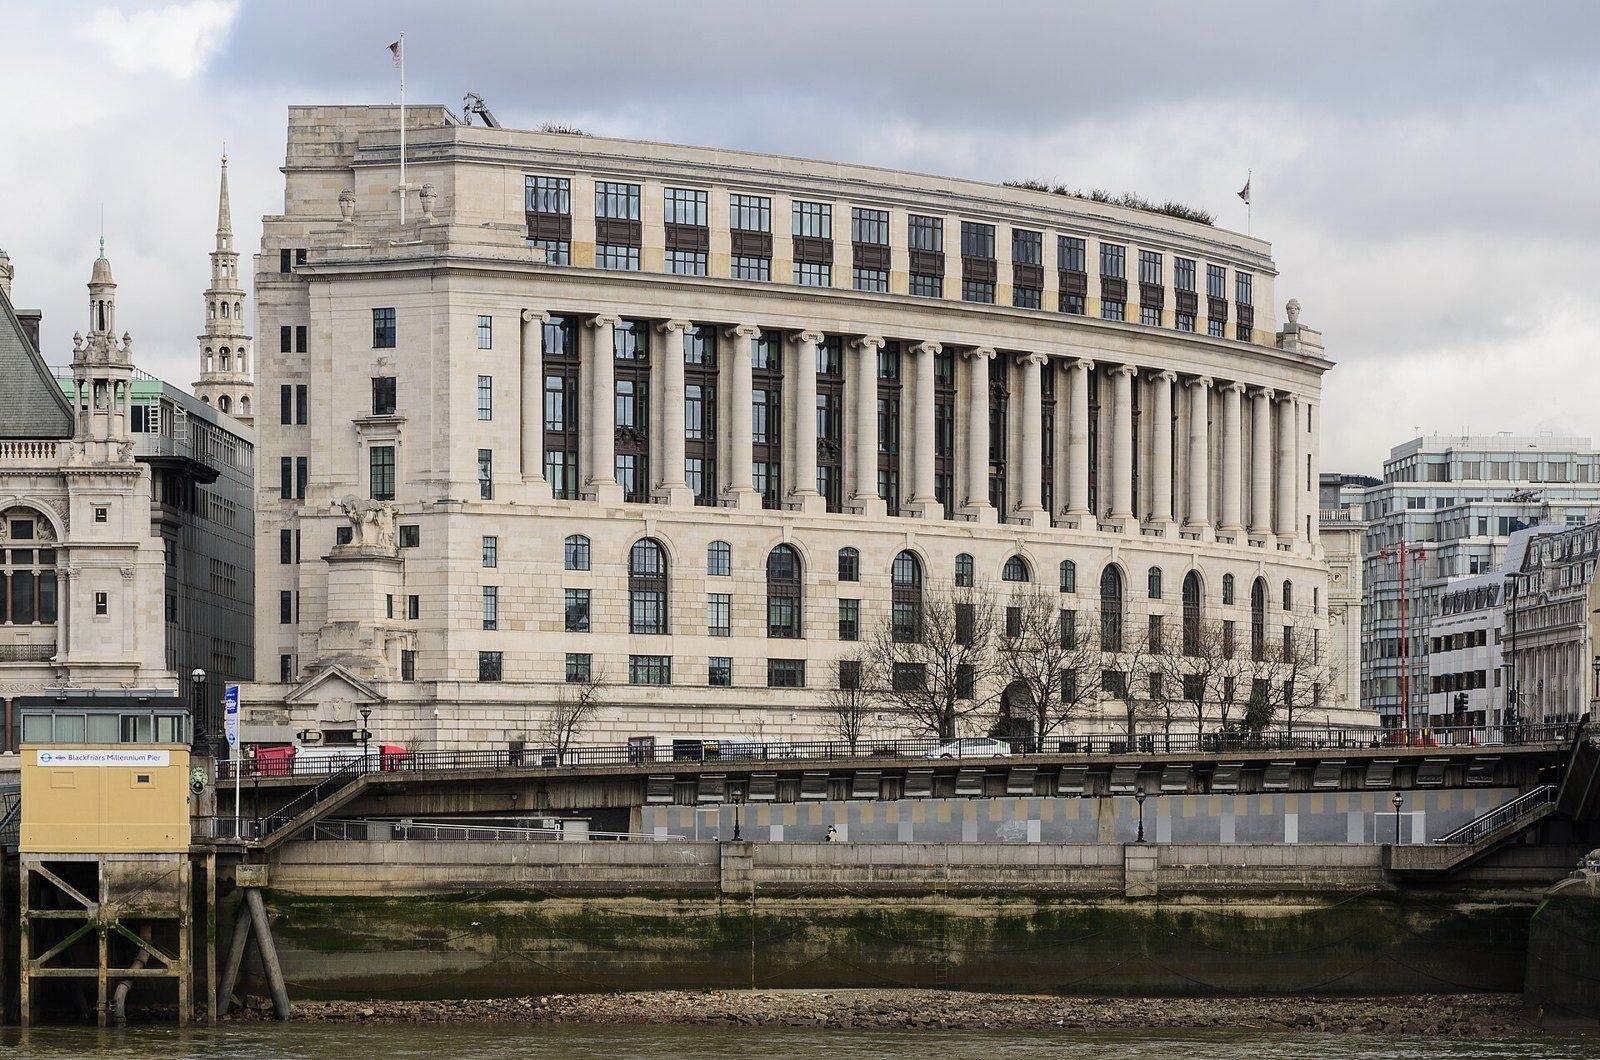 Unilever ≈$56.8BFY2025
 - 56
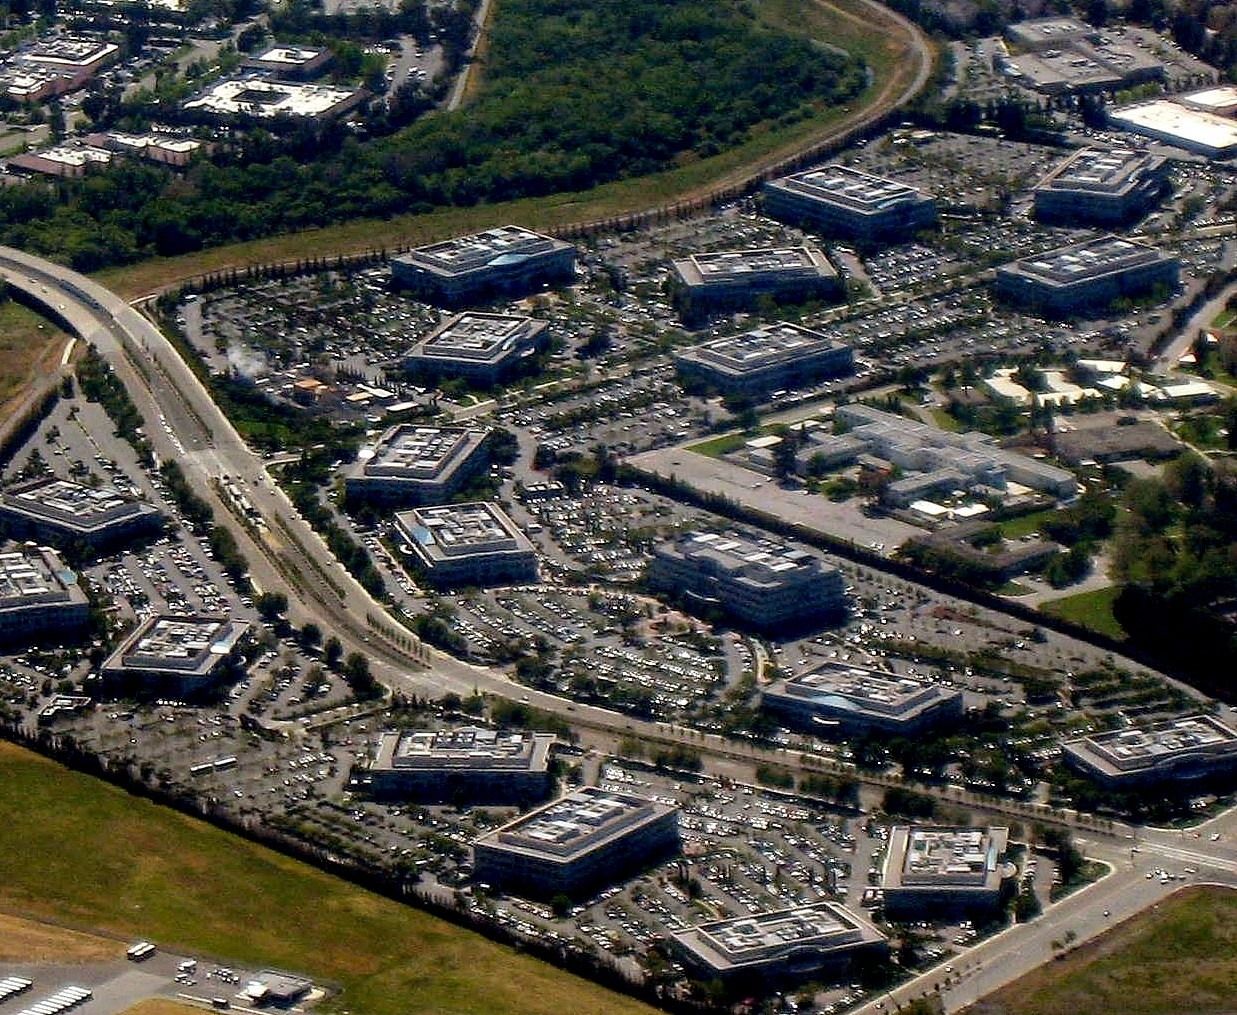 Cisco $56.7B2025
 - 57
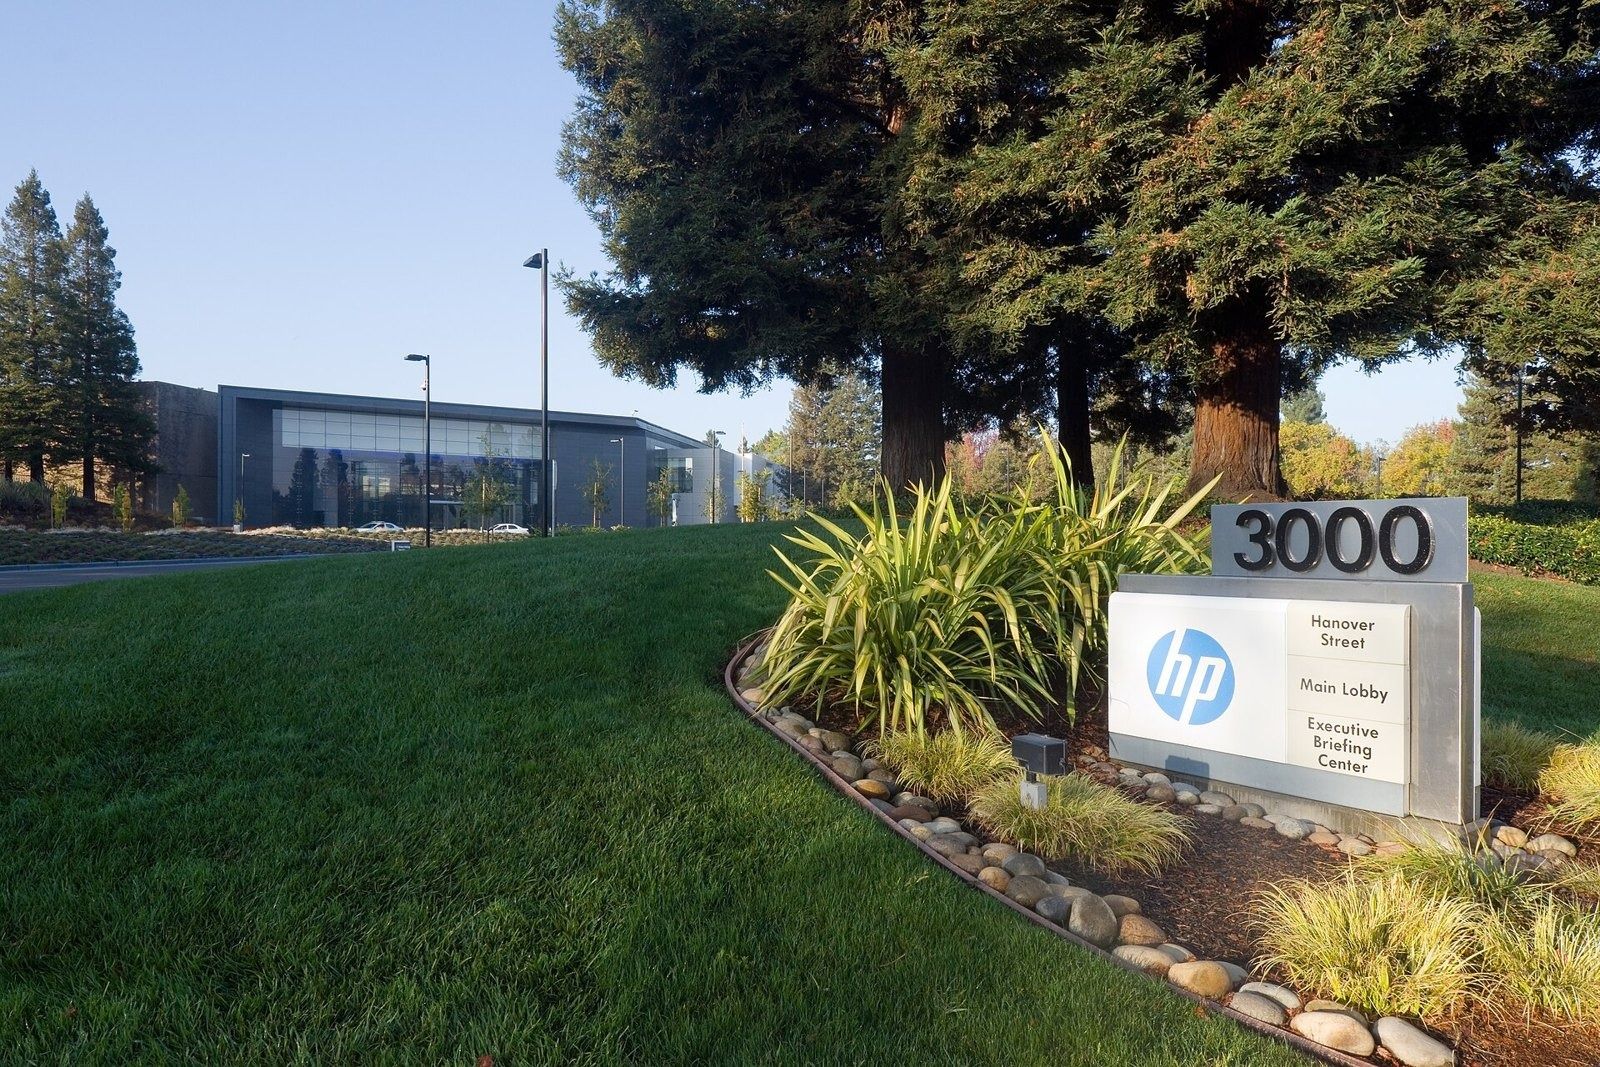 HP Inc. $55.3BFY2025
 - 58
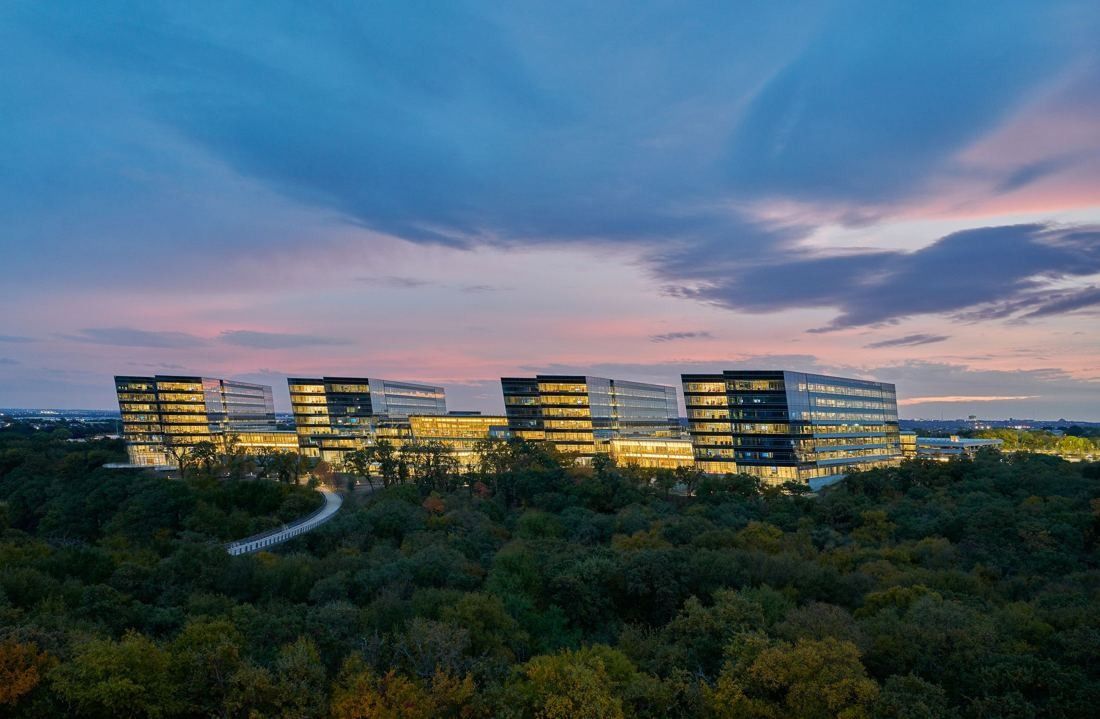 American Airlines $54.6BFY2025
 - 59
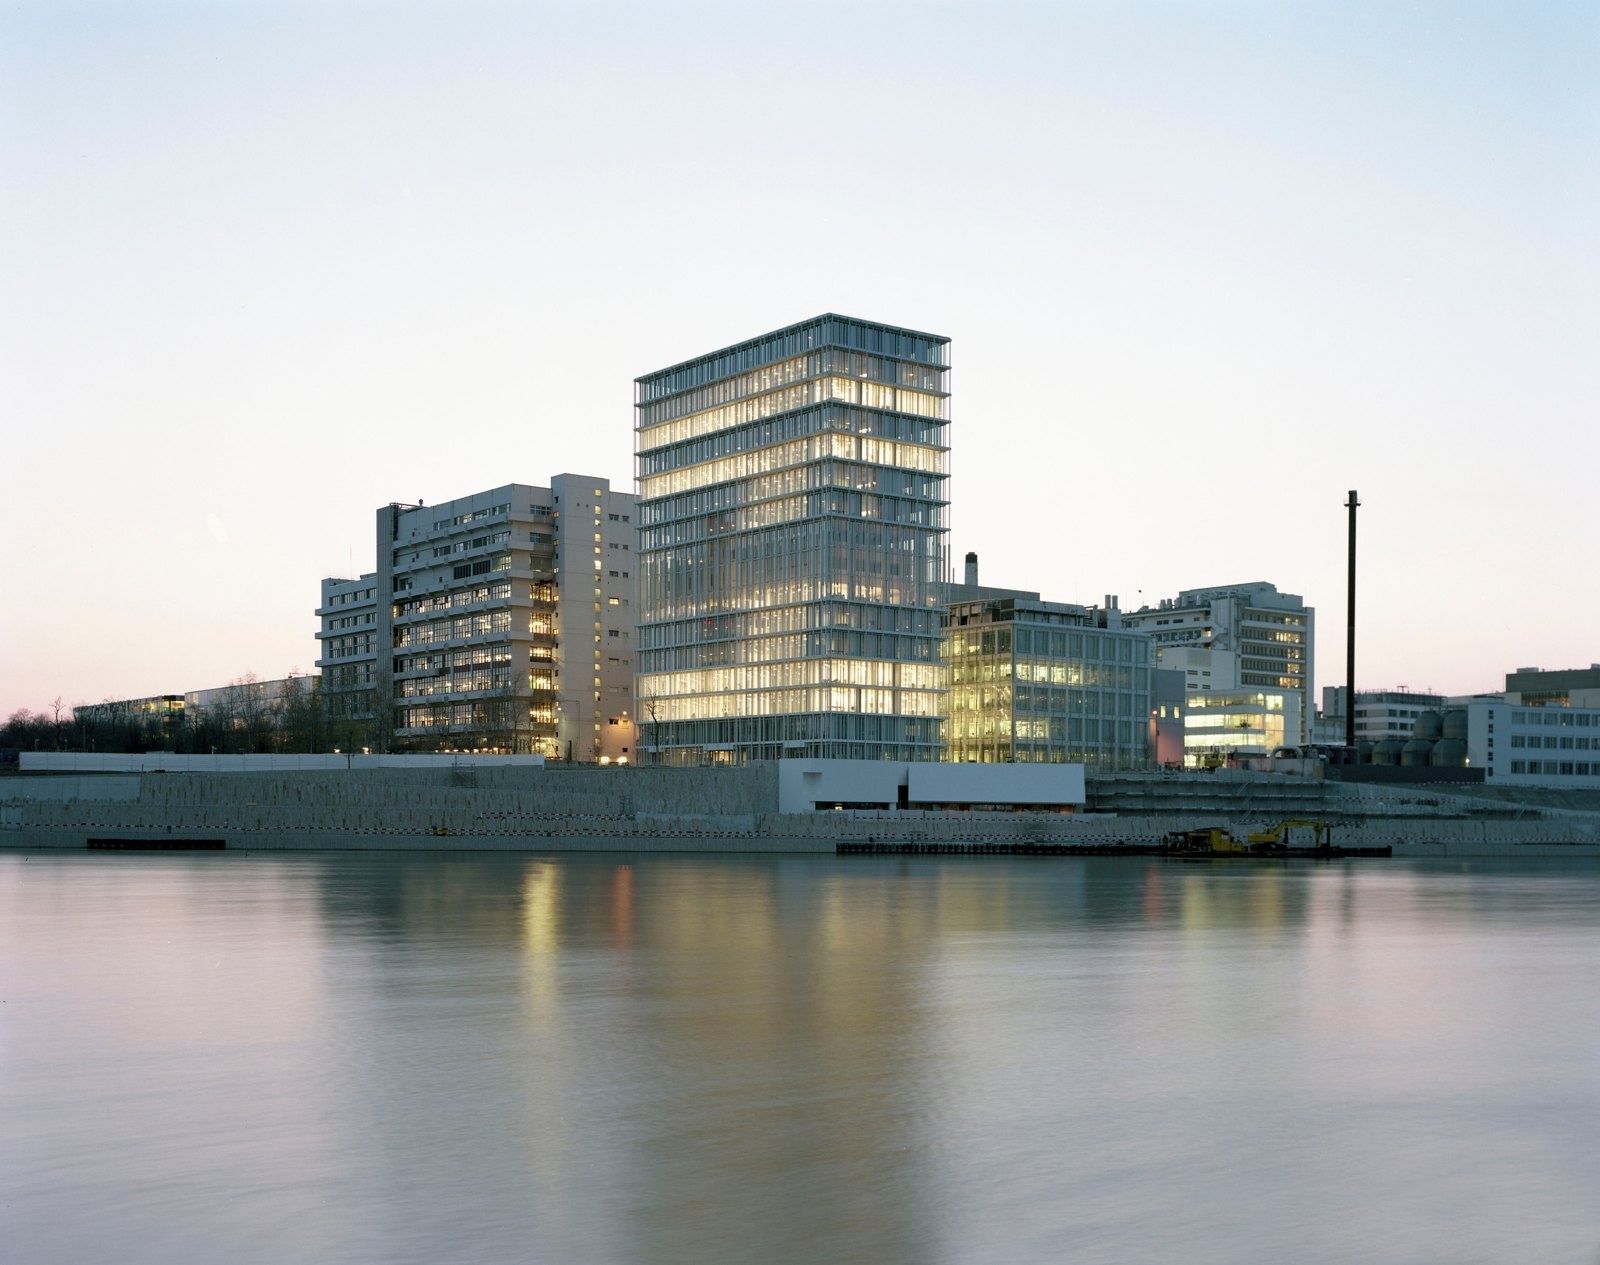 Novartis $54.5BFY2025
 - 60
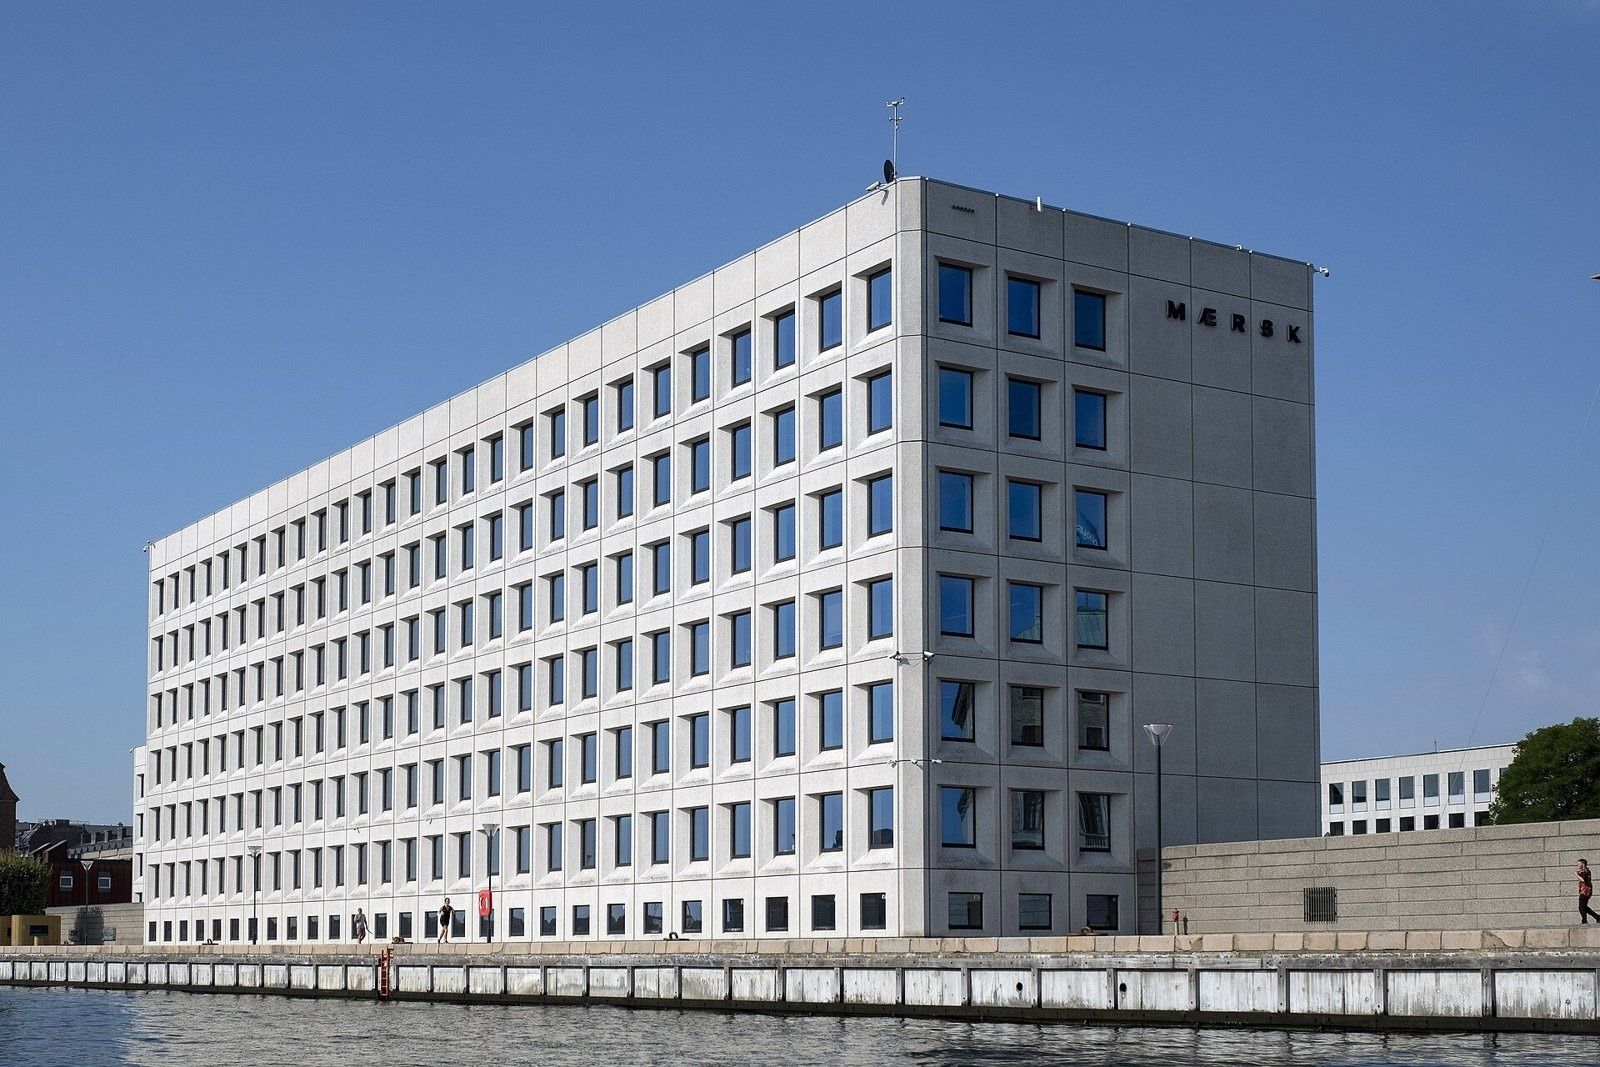 A.P. Moller - Maersk $54.0B2025
 - 61
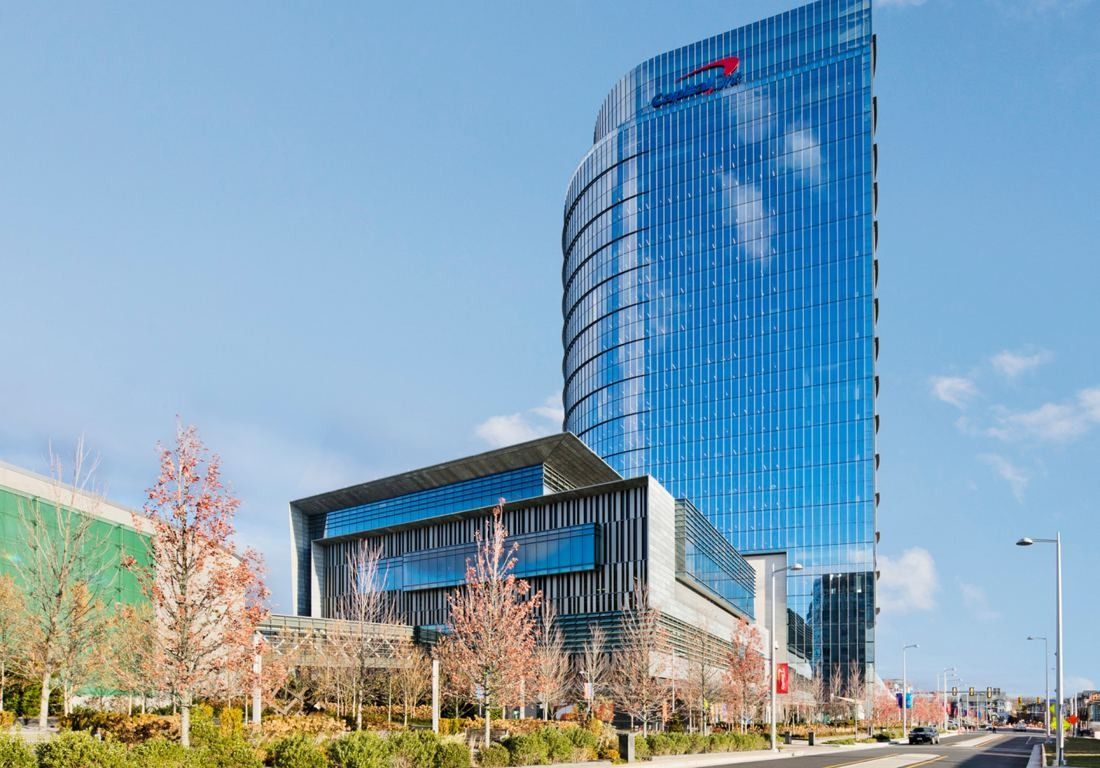 Capital One $53.4BFY2025
 - 62
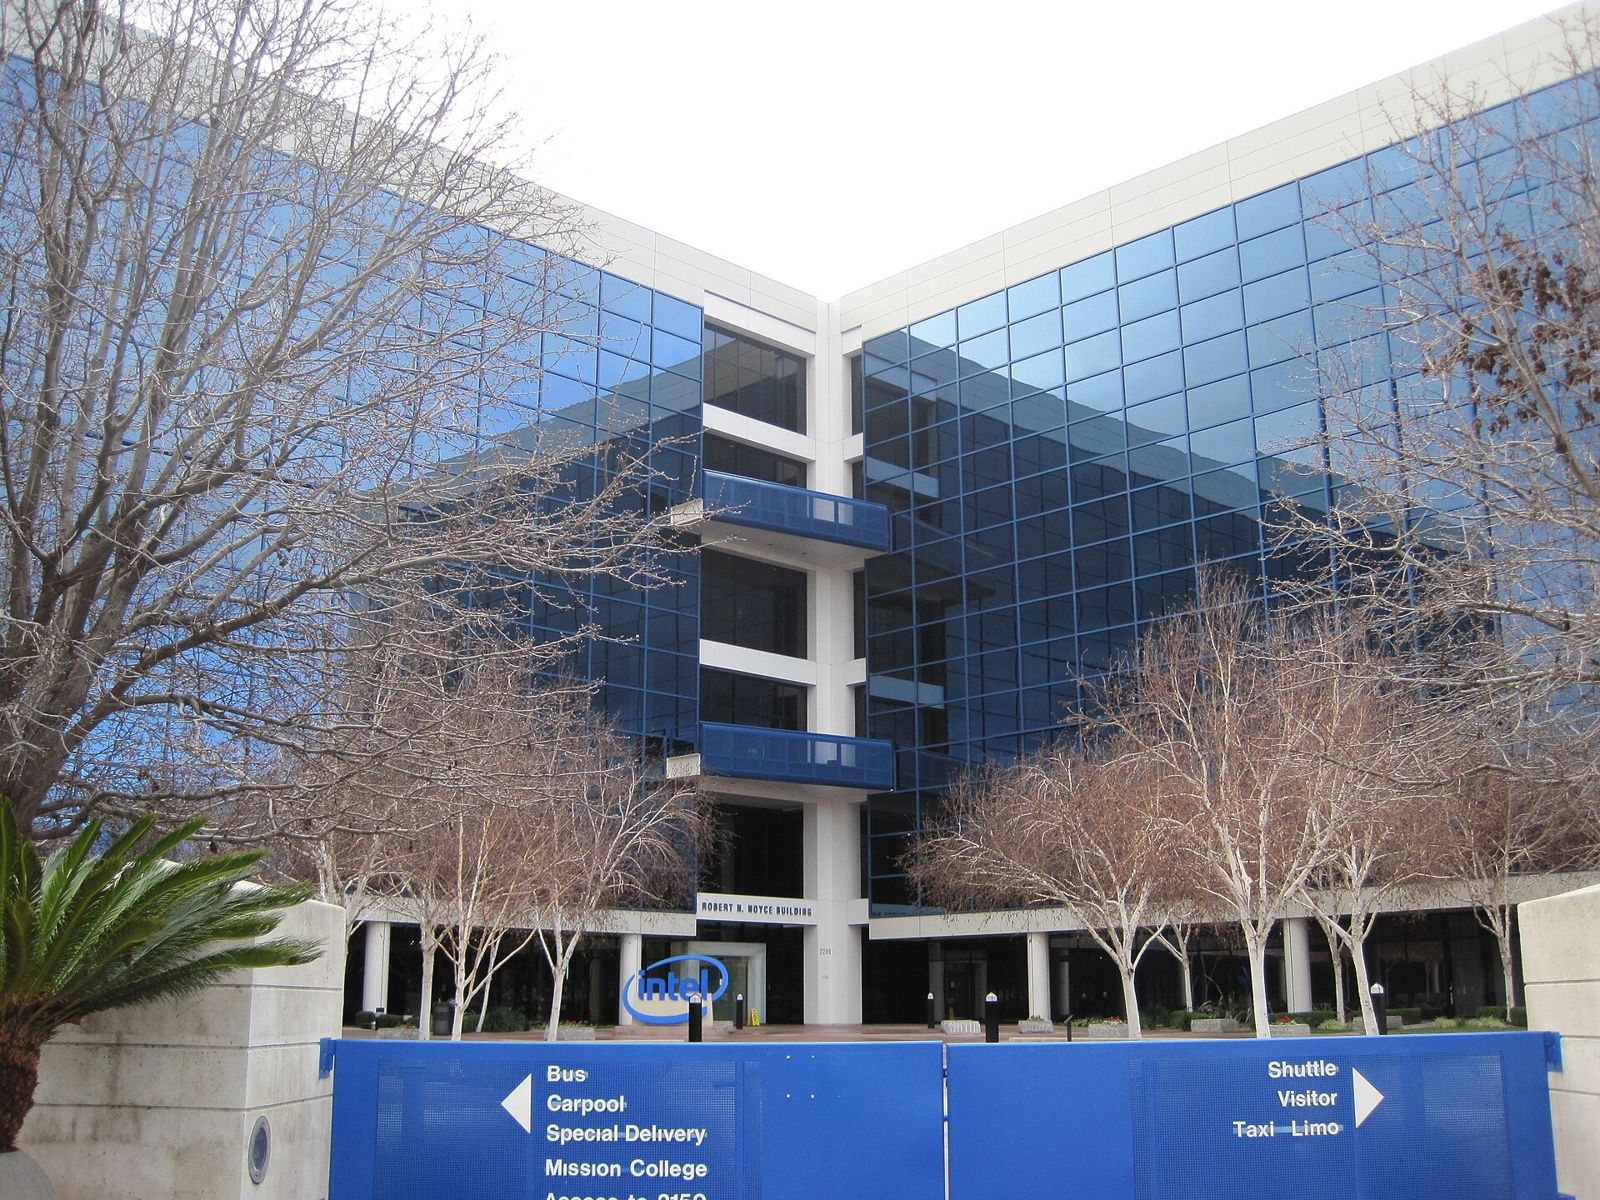 Intel $52.9B2025
 - 63
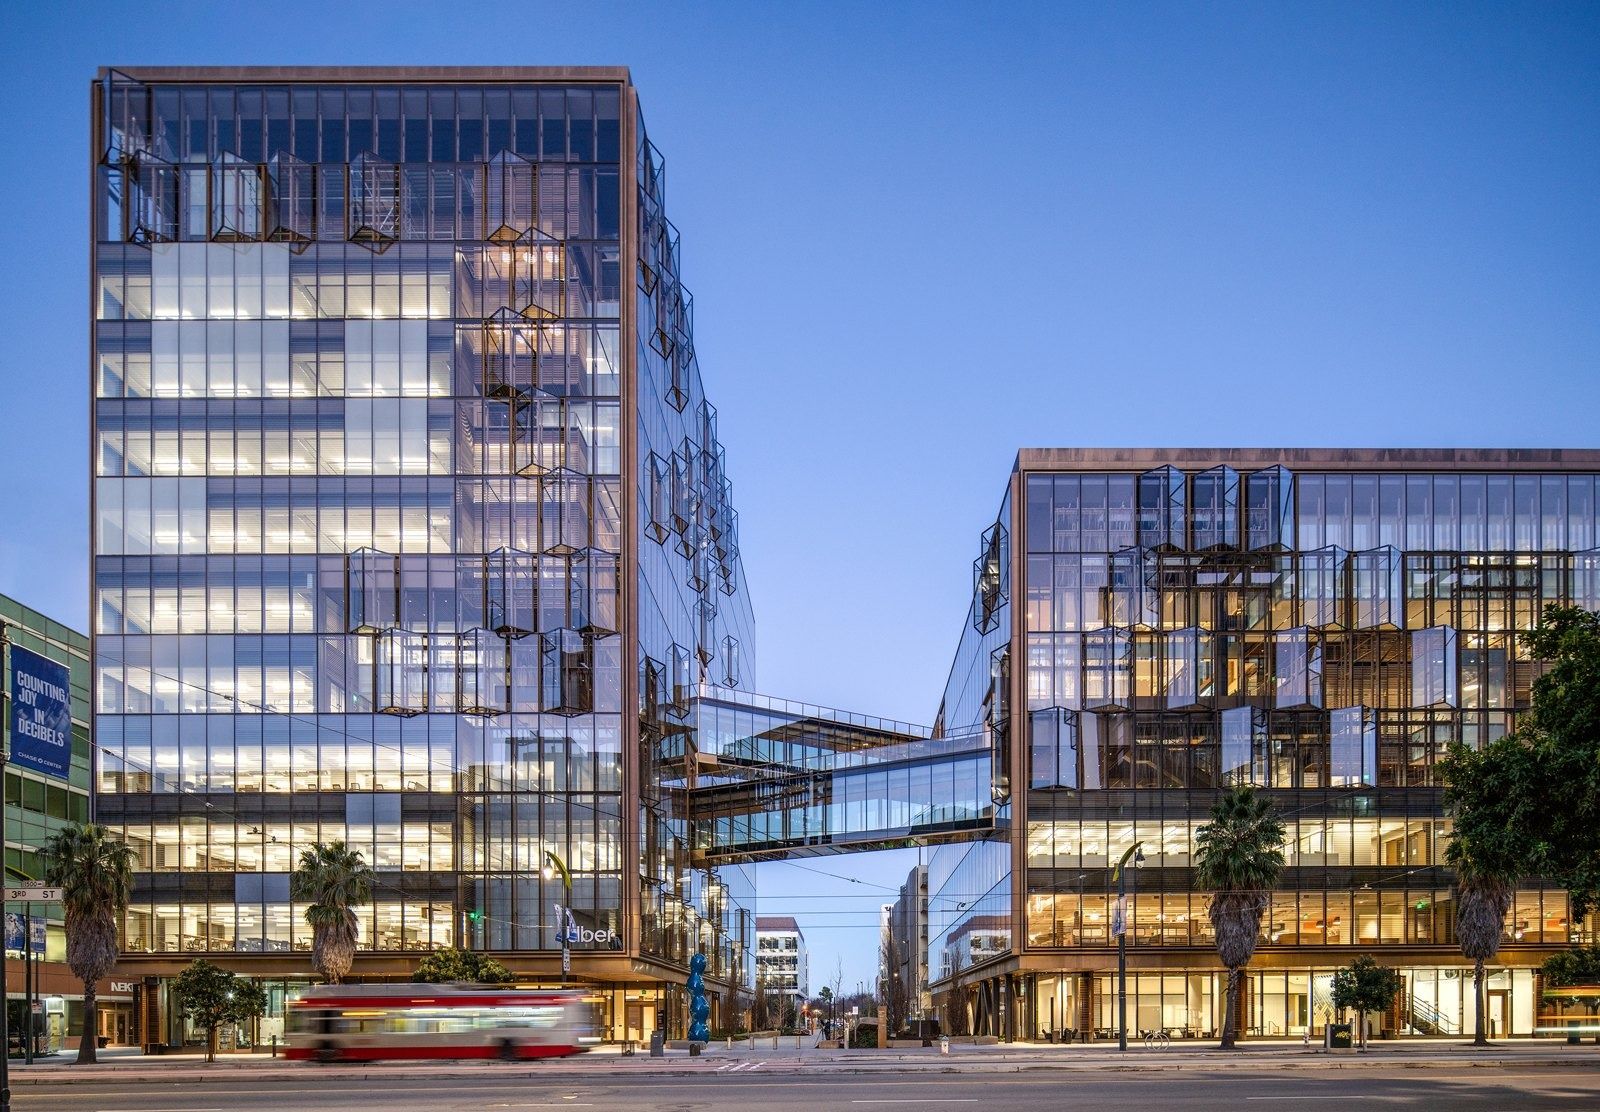 Uber $52.0B2025
 - 64
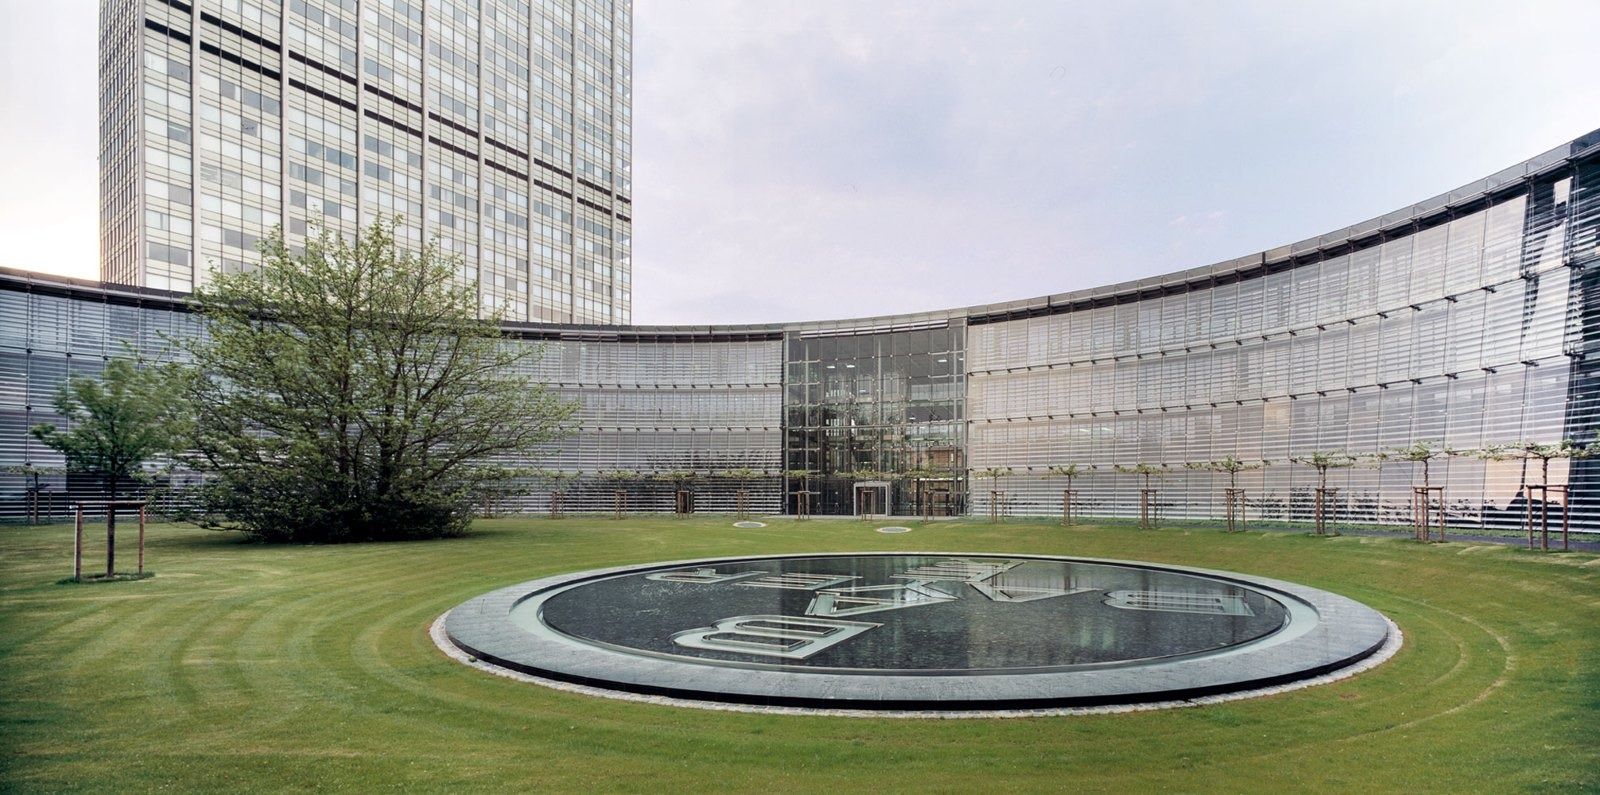 Bayer ≈$51.5B2025
 - 65
 UBS $49.6B2025
 - 66
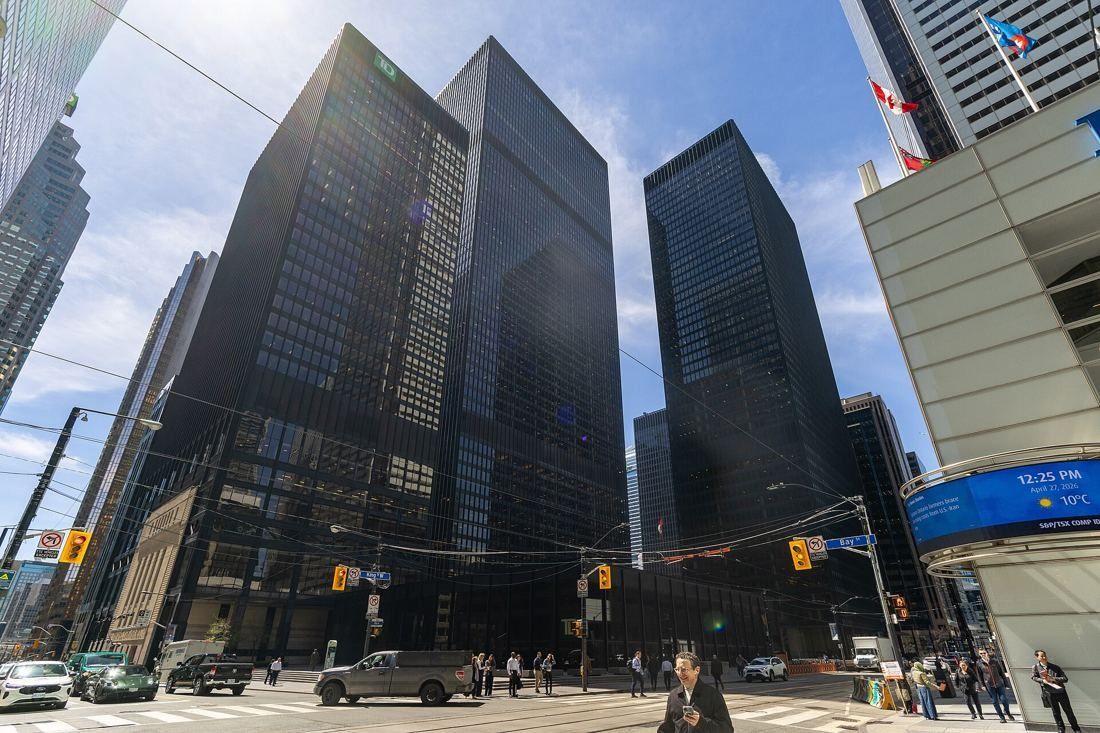 TD Bank Group (The Toronto-Dominion Bank) ≈$48.4BFY2025
 - 67
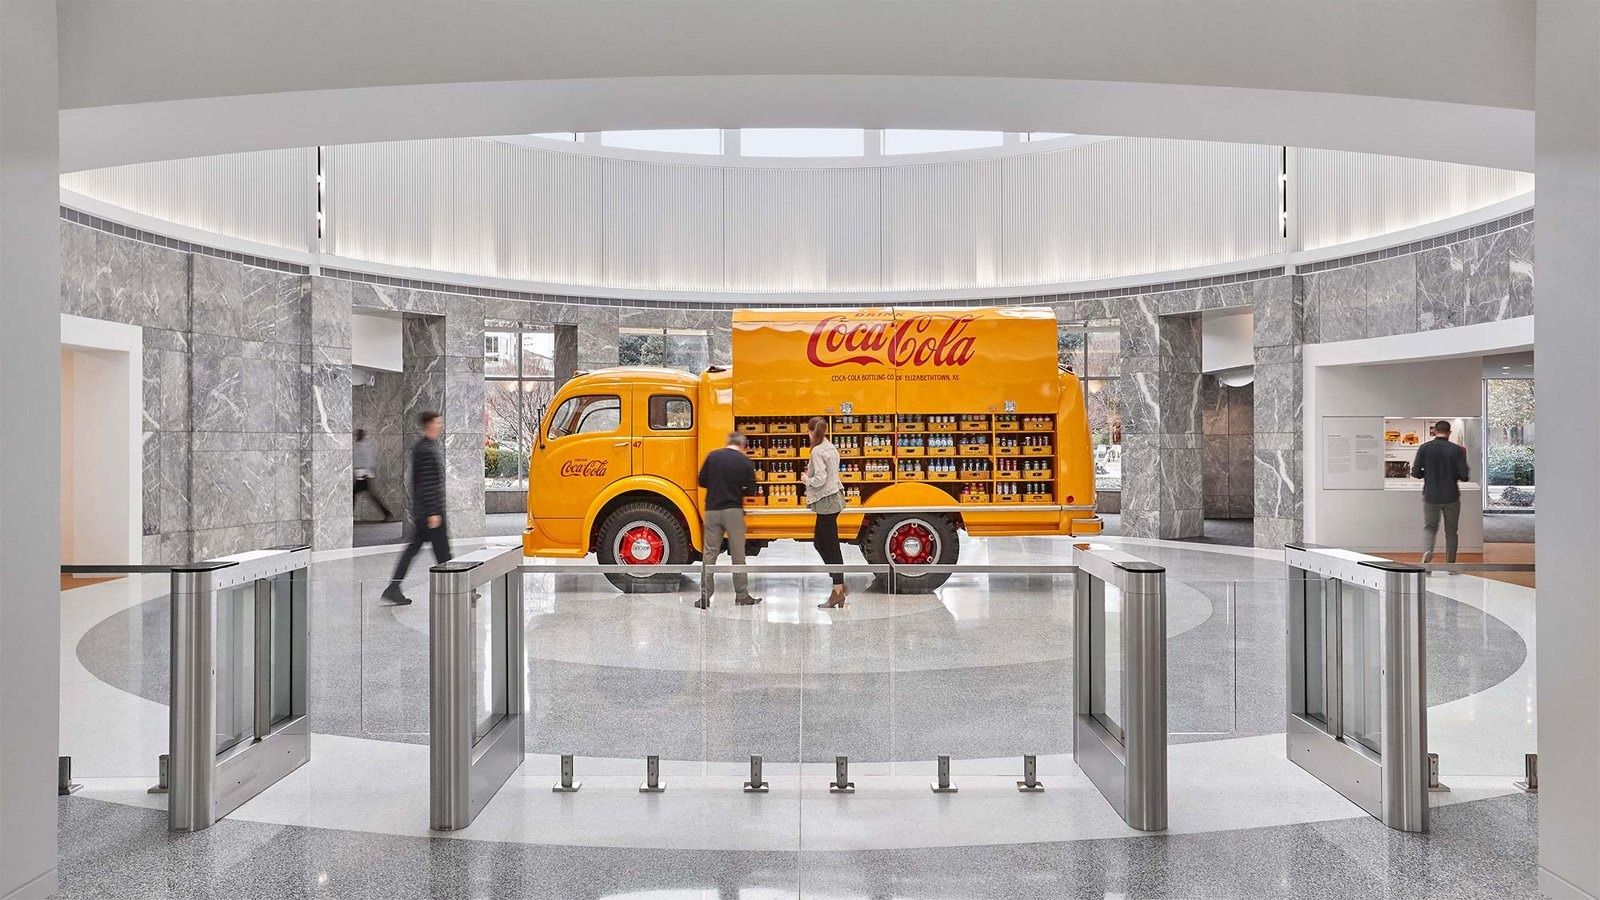 The Coca-Cola Company $47.9BFY2025
 - 68
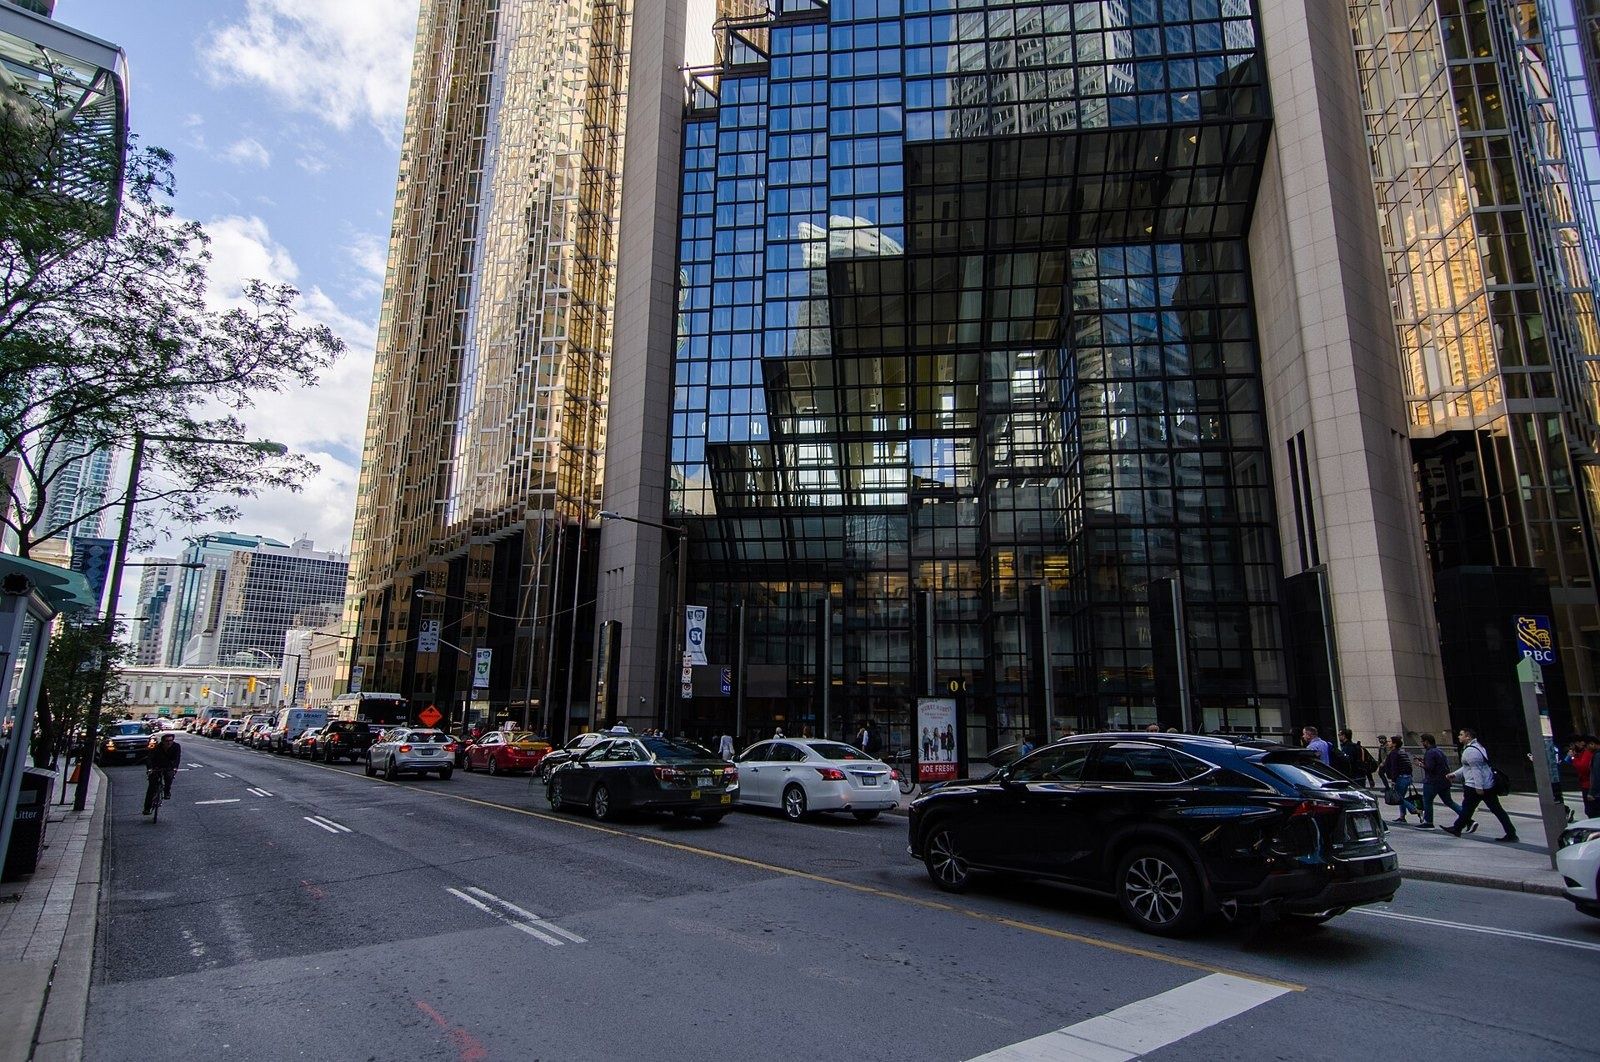 RBC (Royal Bank of Canada) ≈$47.4BFY2025
 - 69
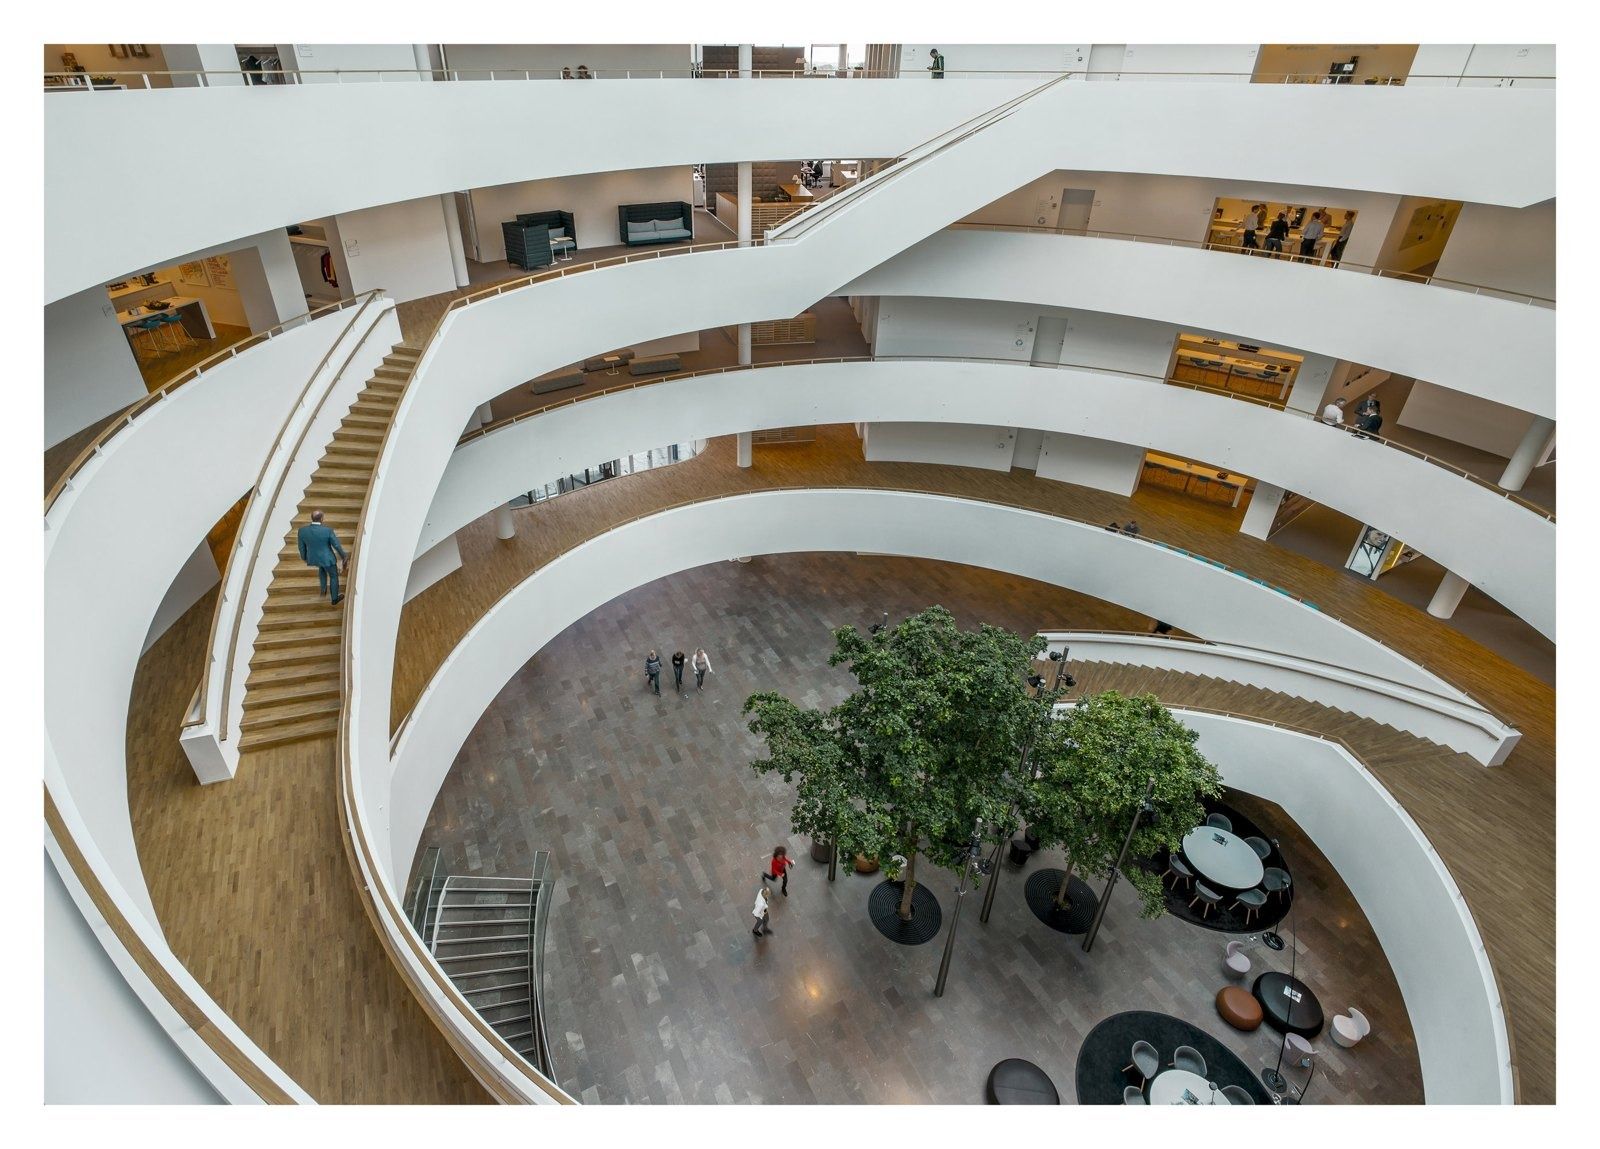 Novo Nordisk ≈$46.7B2025
 - 70
 Nike $46.4BFY2026
 - 71
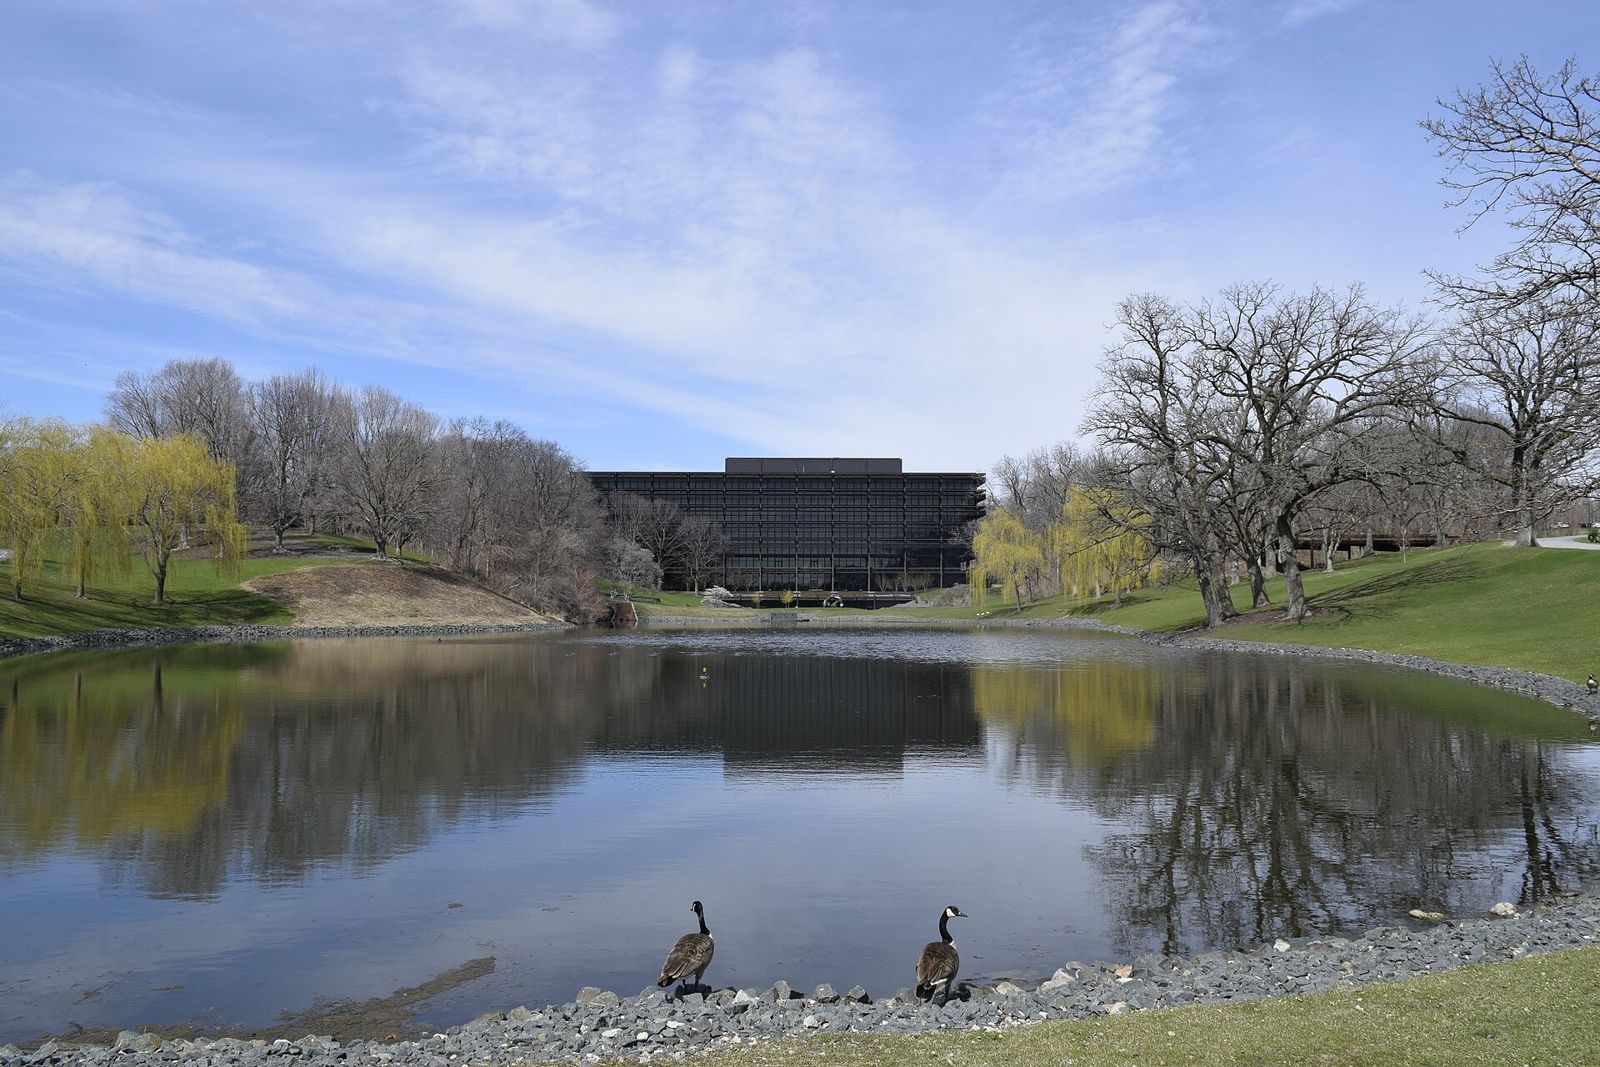 John Deere $45.7B2025
 - 72
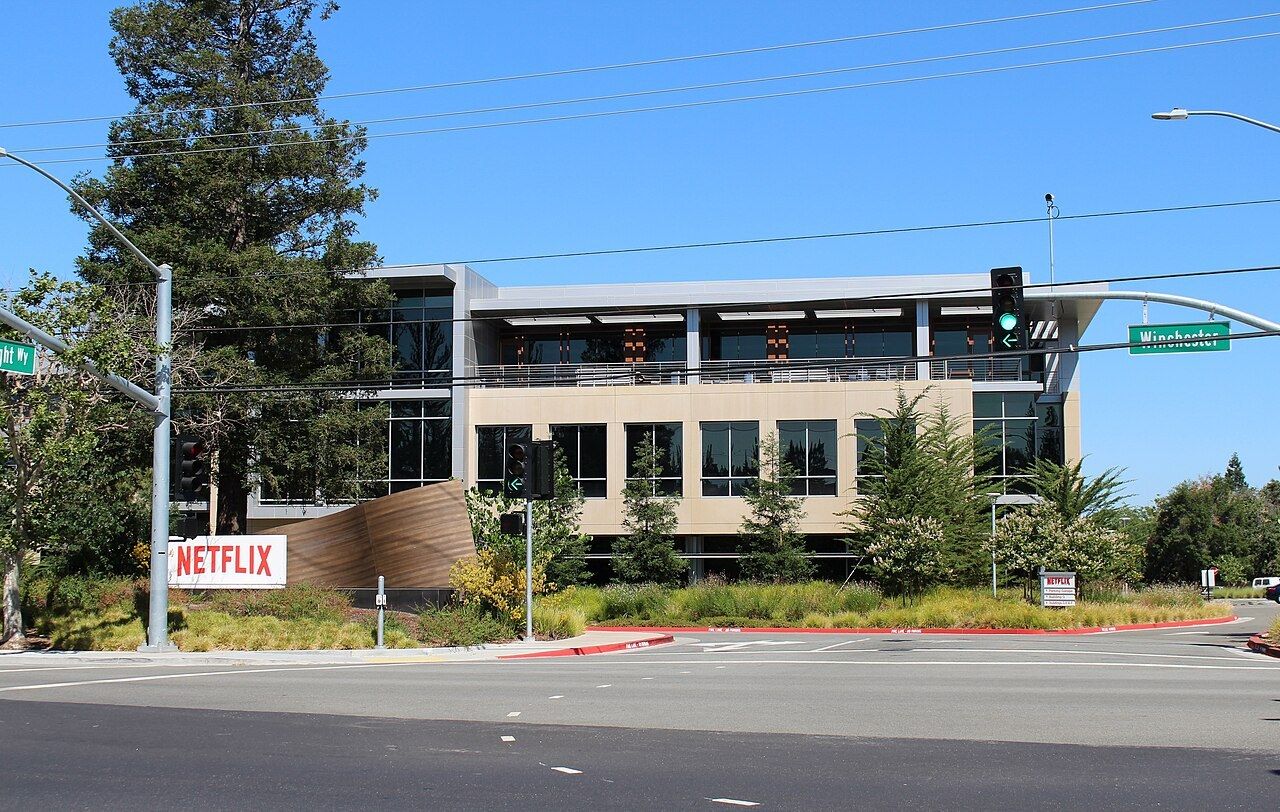 Netflix $45.2B2025
 - 73
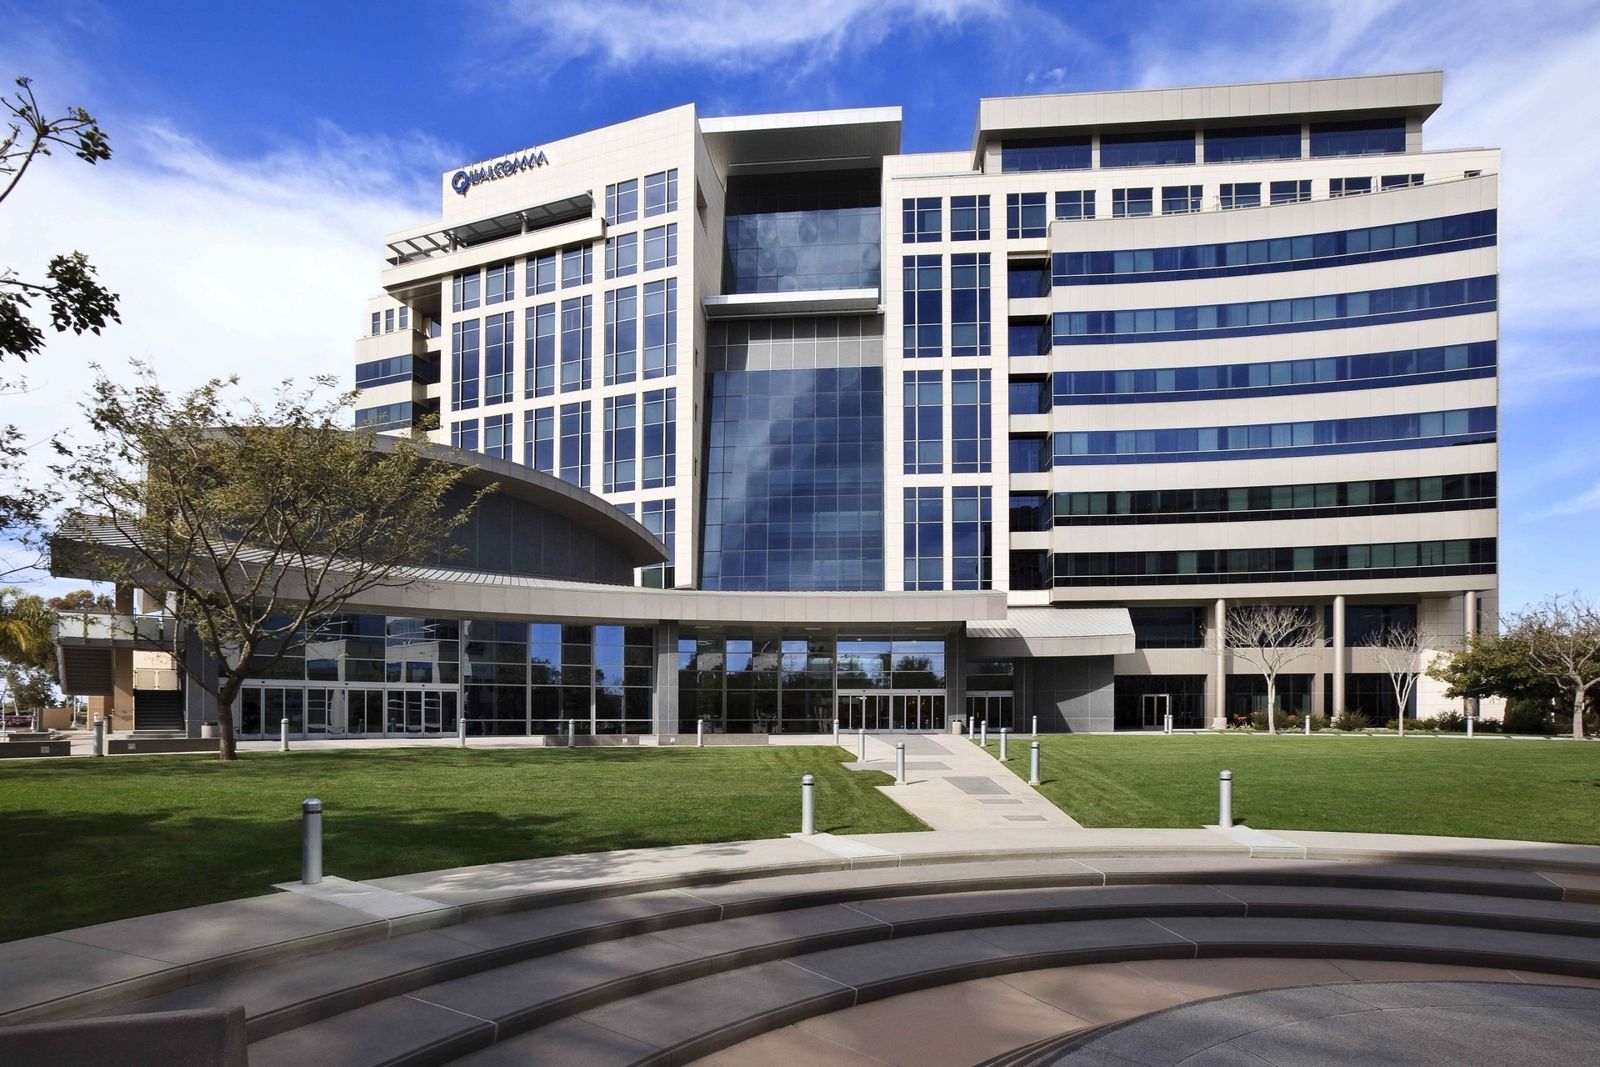 Qualcomm $44.3B2025
 - 74
 GSK $42.8B2025
 - 75
 Best Buy $41.7BFY2026
 - 76
 Salesforce $41.5BFY2026
 - 77
 CBRE $40.5B2025
 - 78
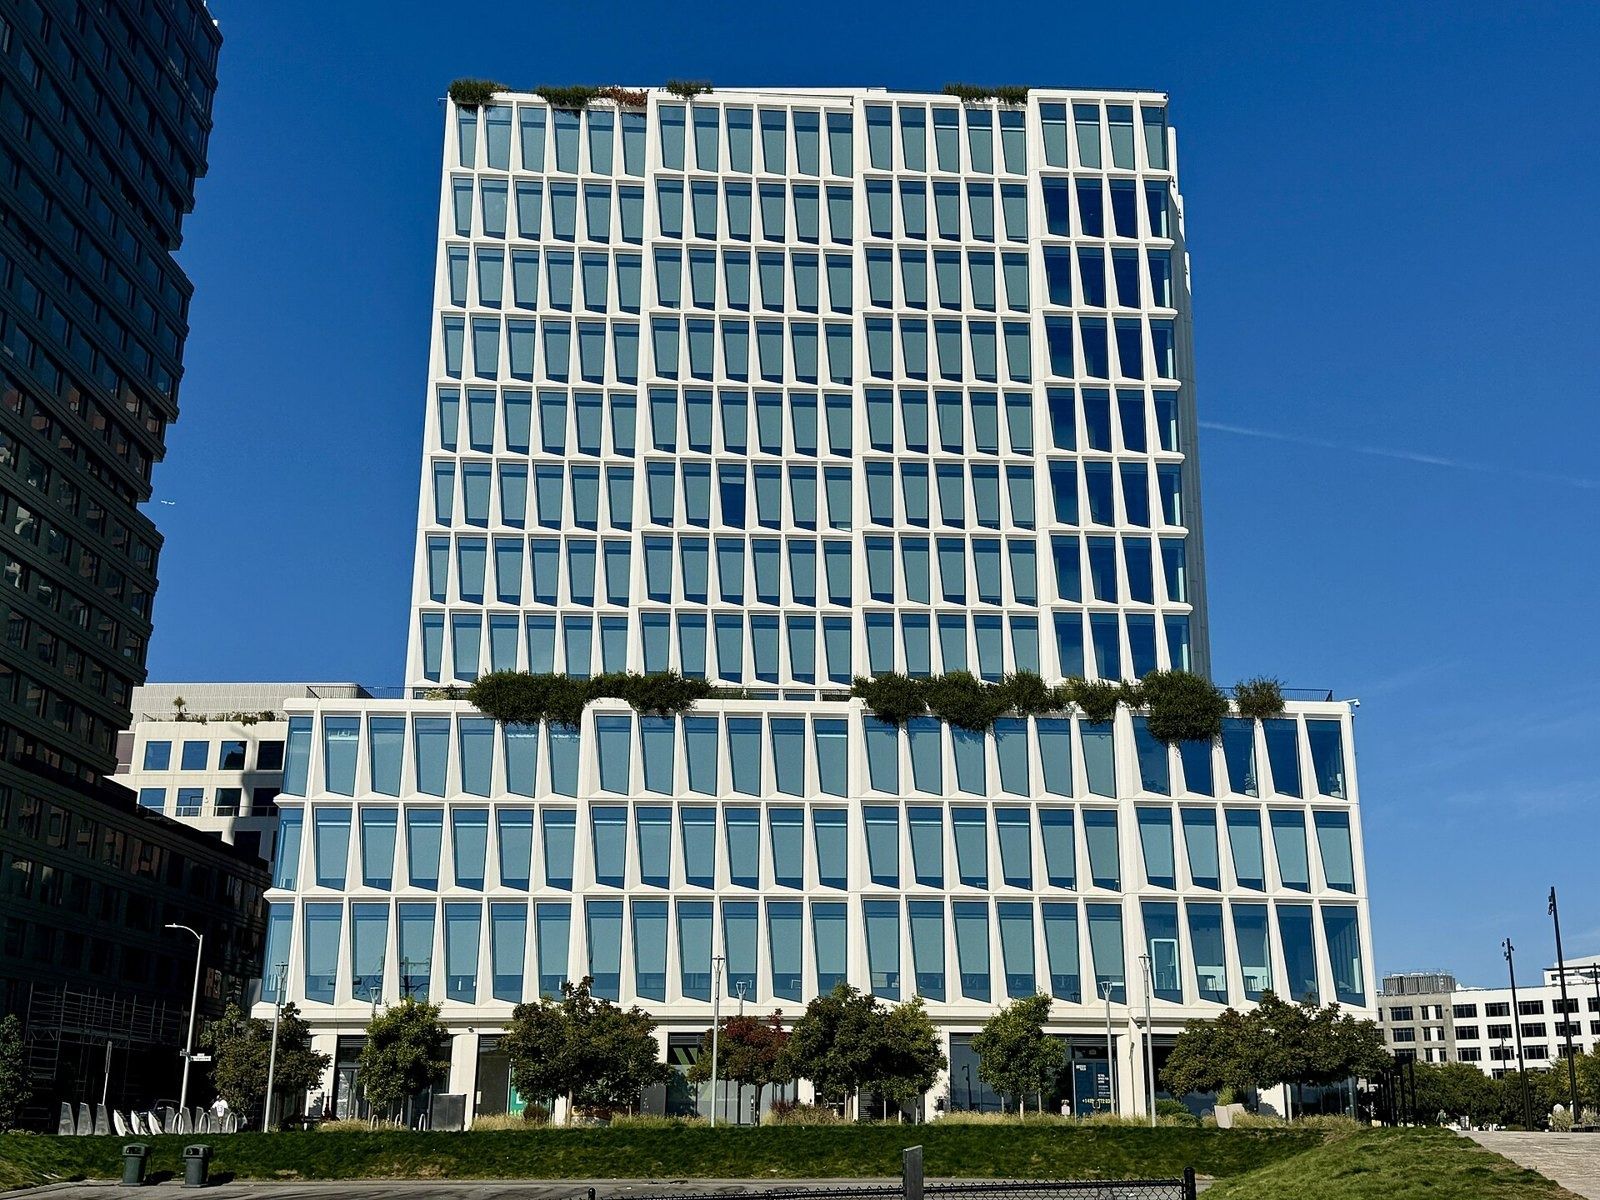 Visa $40.0BFY2025
 - 79
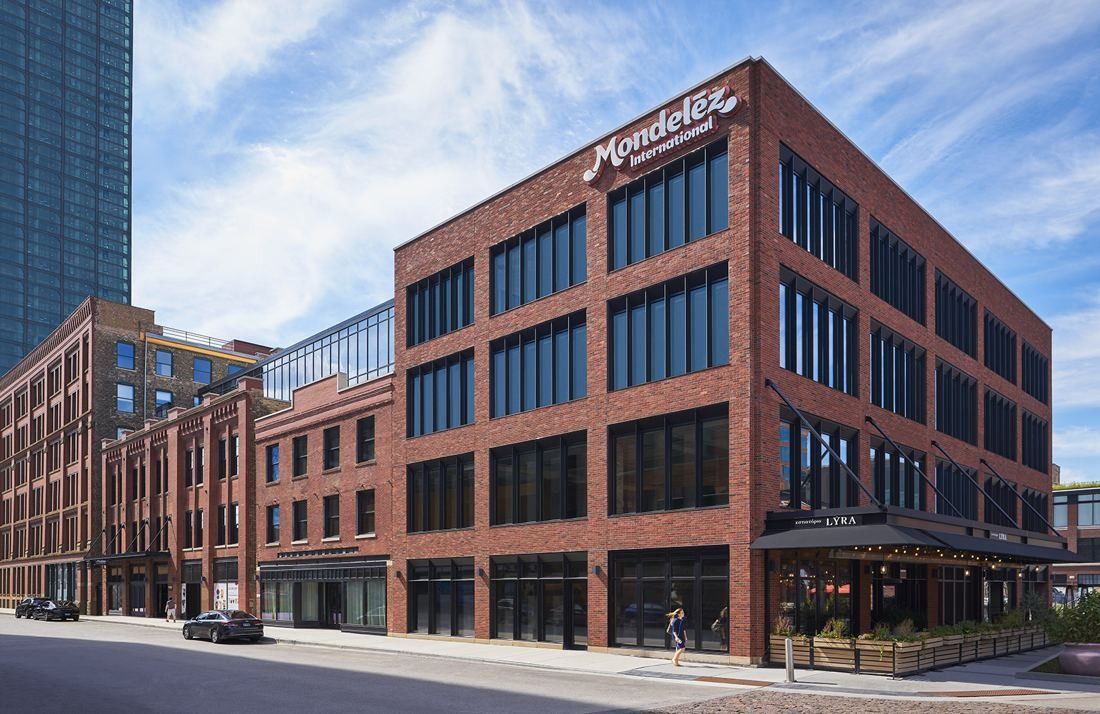 Mondelēz International $38.5BFY2025
 - 80
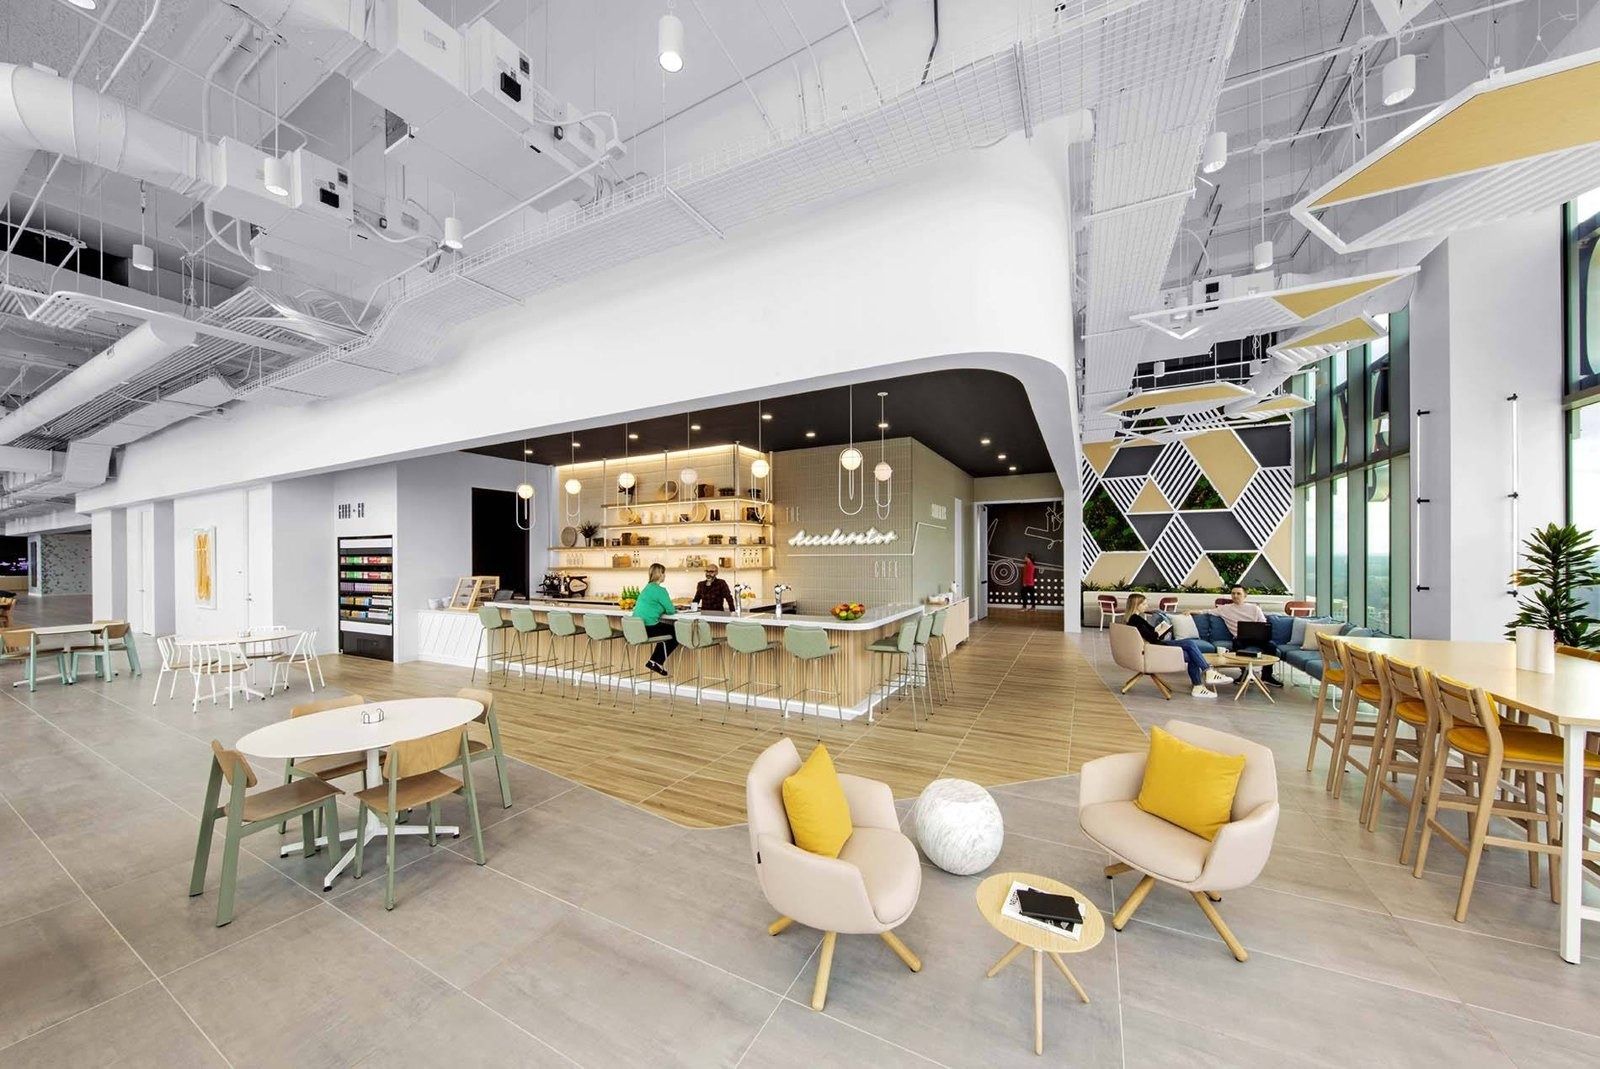 Honeywell $37.4B2025
 - 81
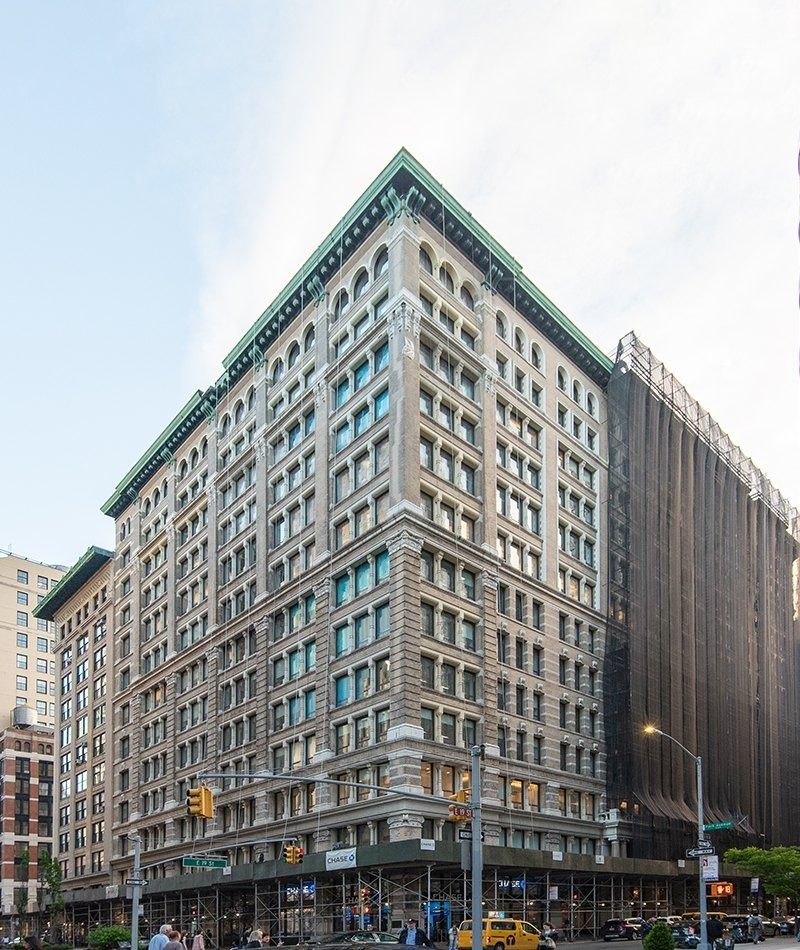 Warner Bros. Discovery $37.3BFY2025
 - 82
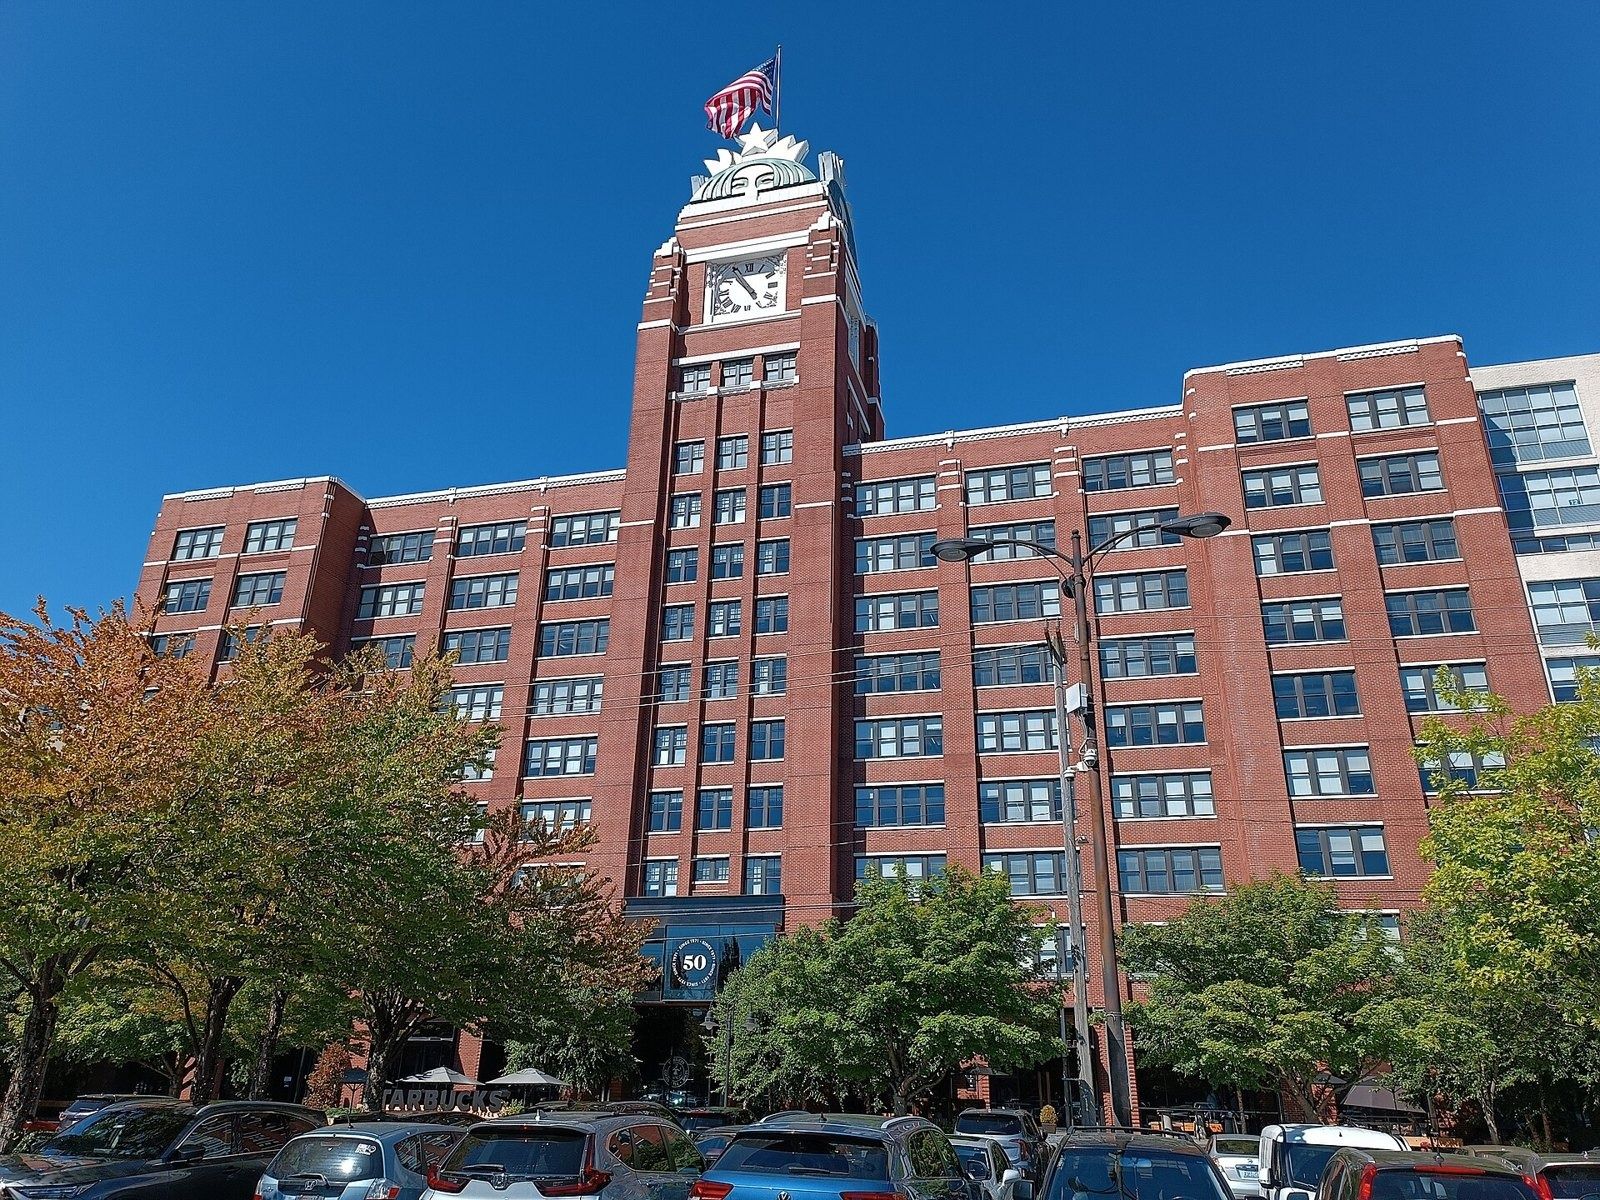 Starbucks $37.2BFY2025
 - 83
 Amgen $36.8B2025
 - 84
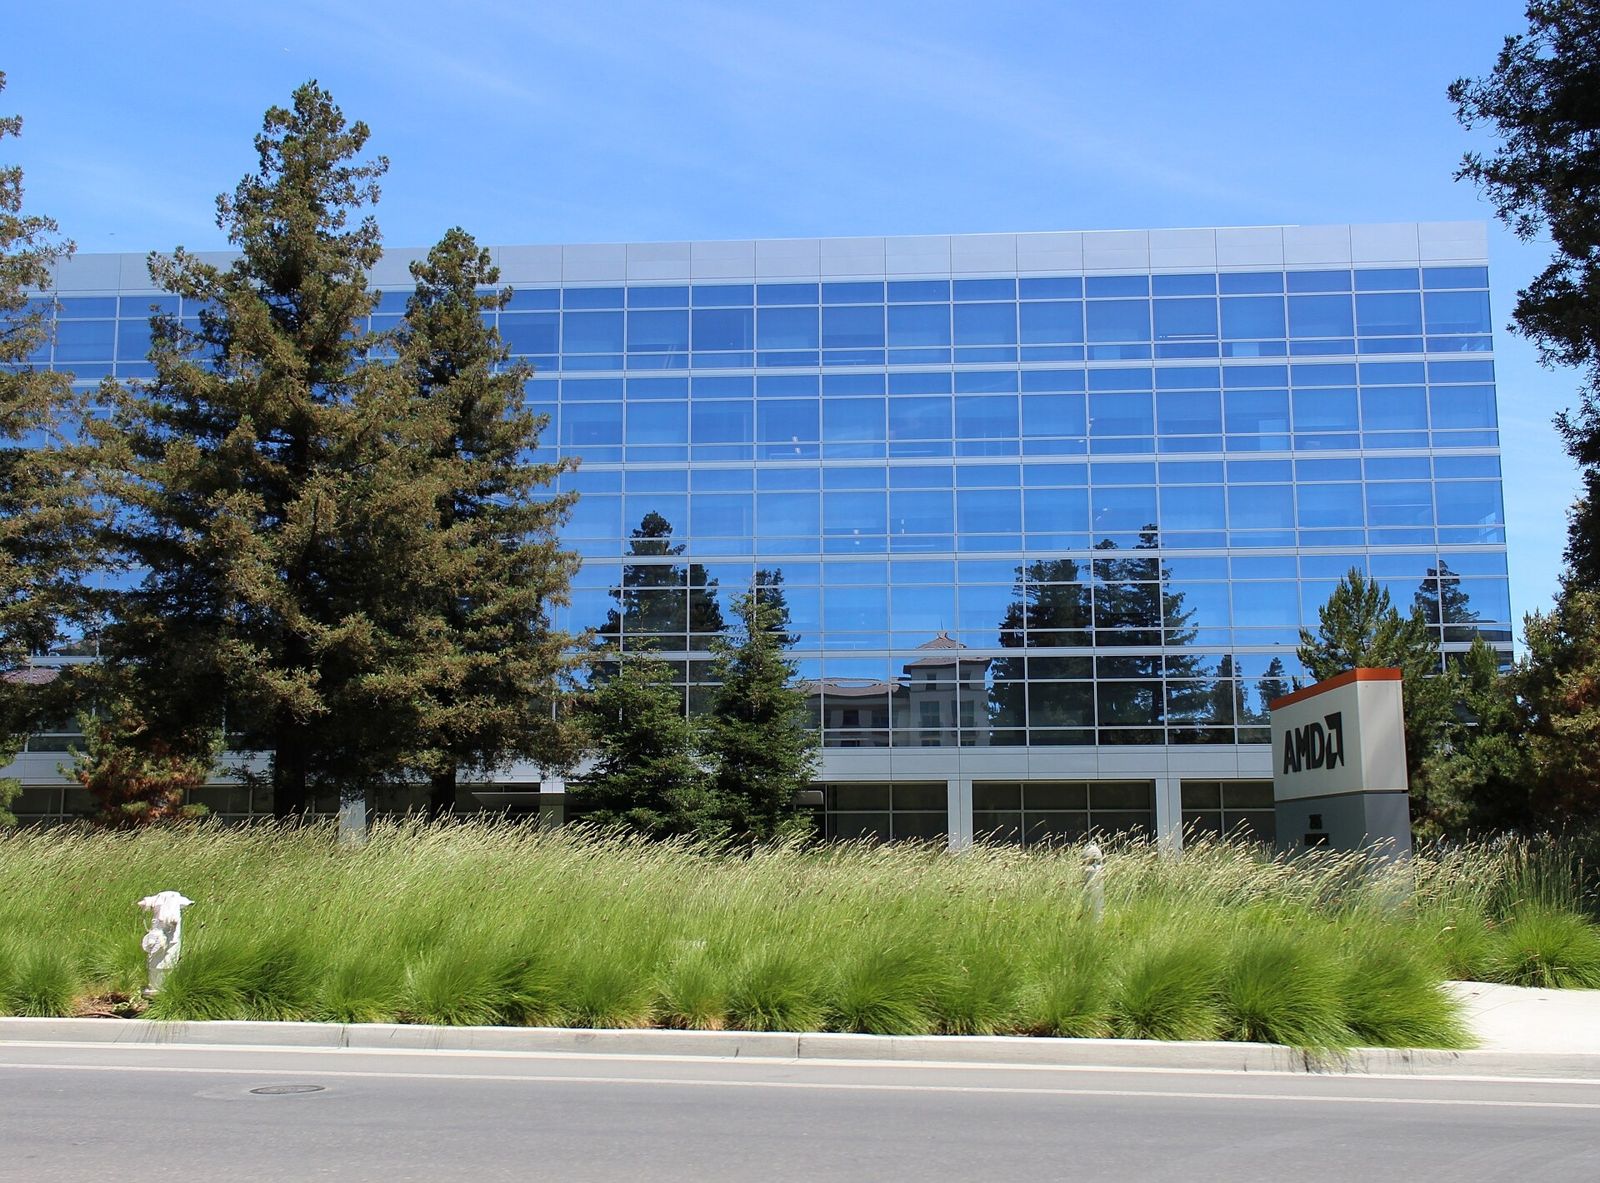 AMD $34.6B2025
 - 85
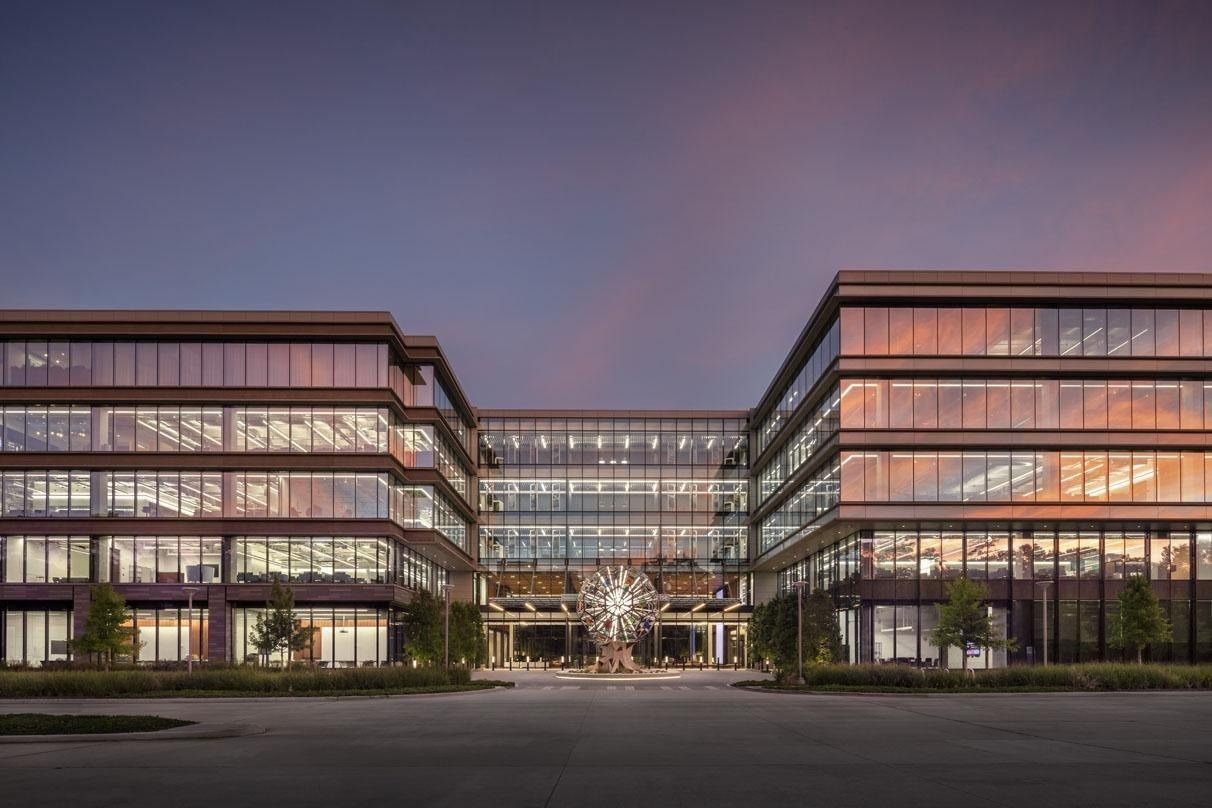 Hewlett Packard Enterprise $34.3BFY2025
 - 86
 Cummins $33.7B2025
 - 87
 PayPal $33.2B2025
 - 88
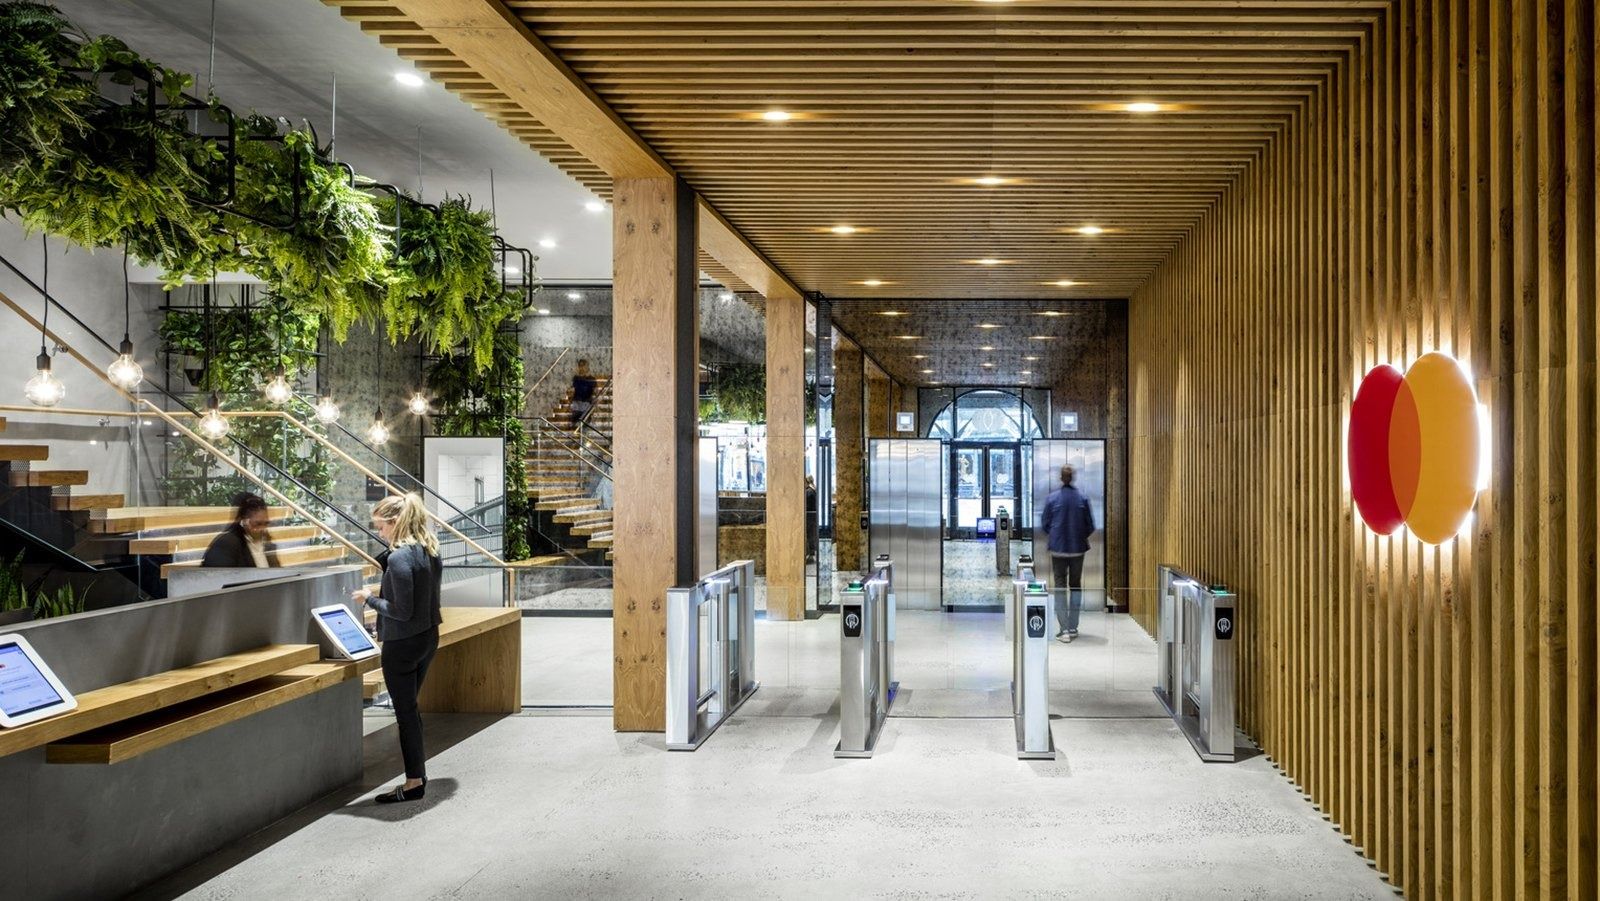 Mastercard $32.8B2025
 - 89
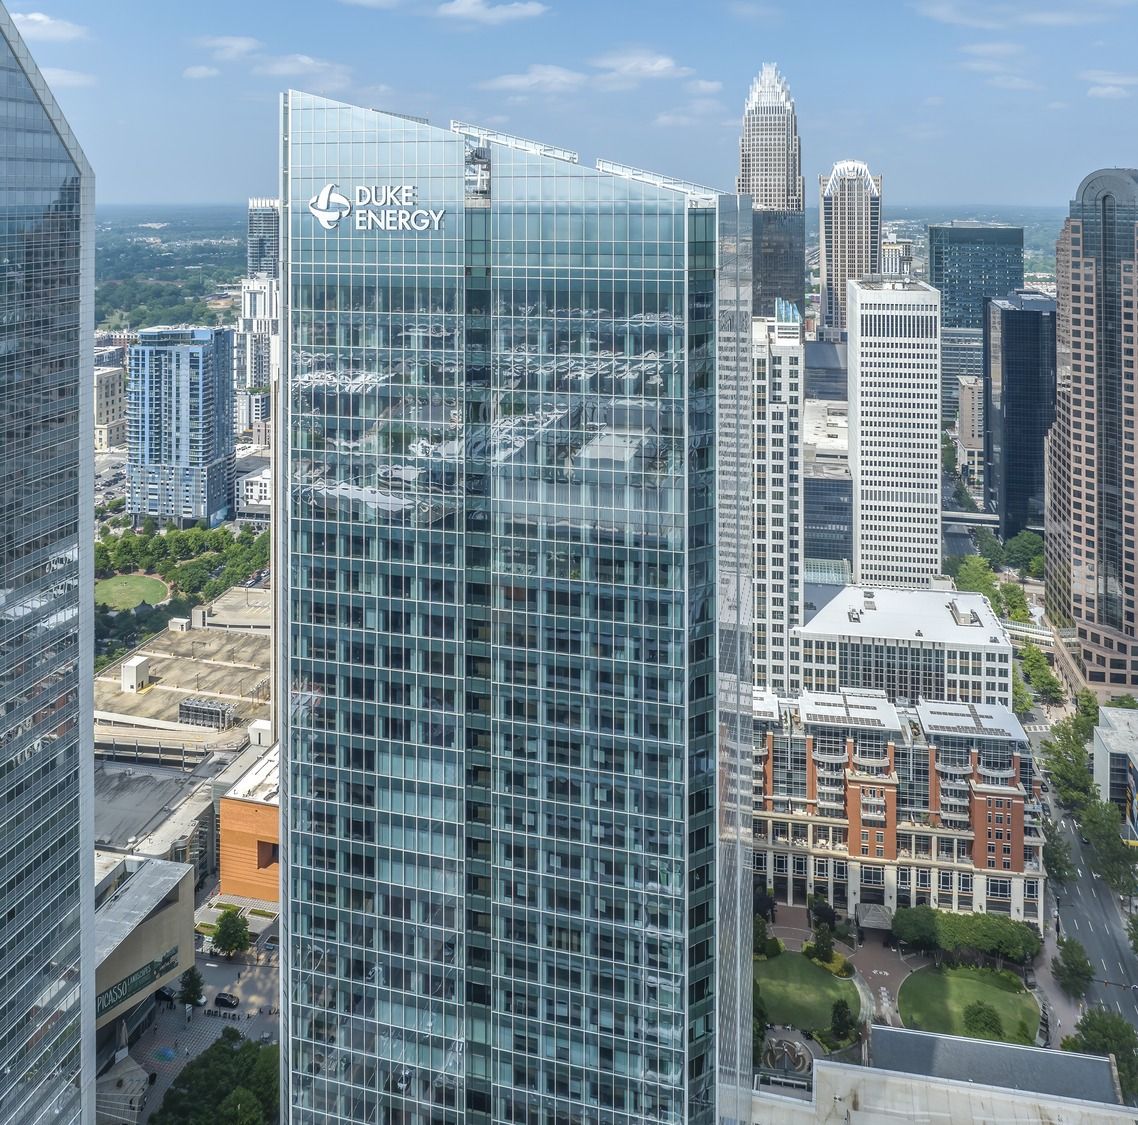 Duke Energy $31.7B2025
 - 90
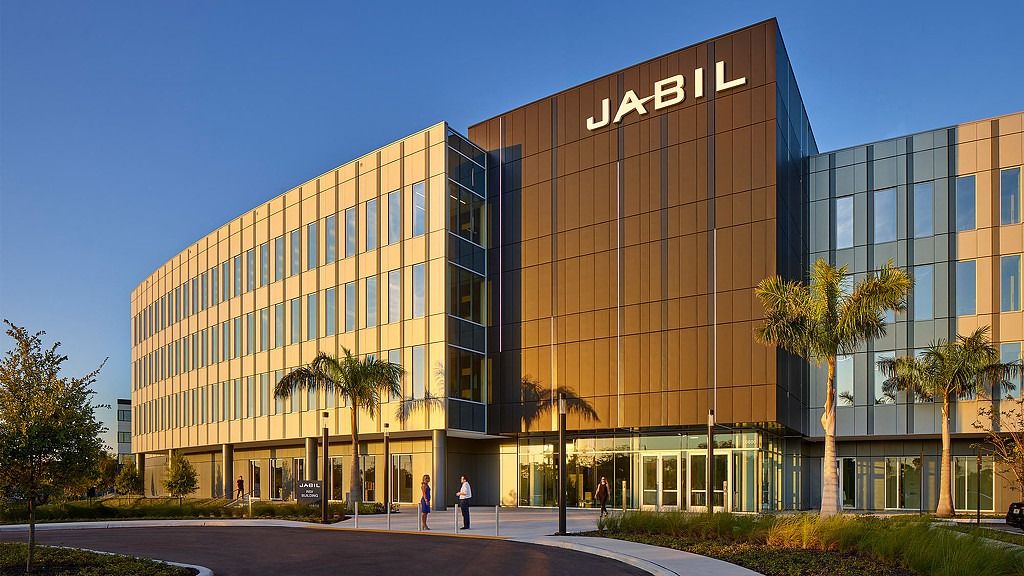 Jabil $29.8B2025
 - 91
 adidas $28.0B2025
 - 92
 Eaton $27.4B2025
 - 93
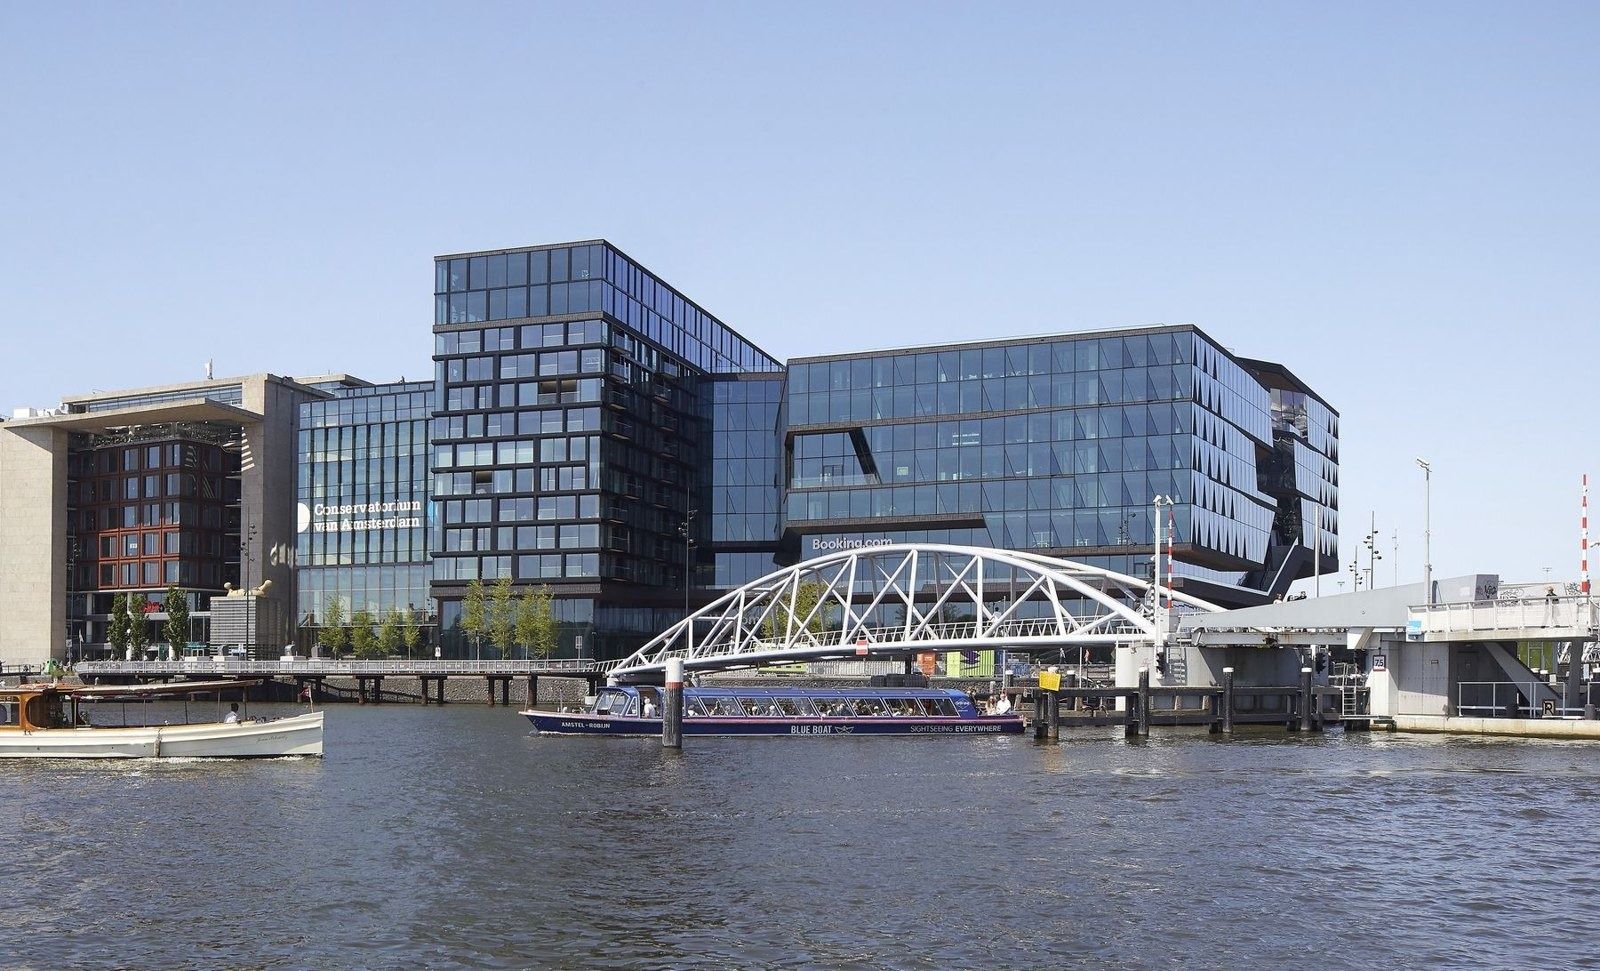 Booking Holdings $26.9B2025
 - 93
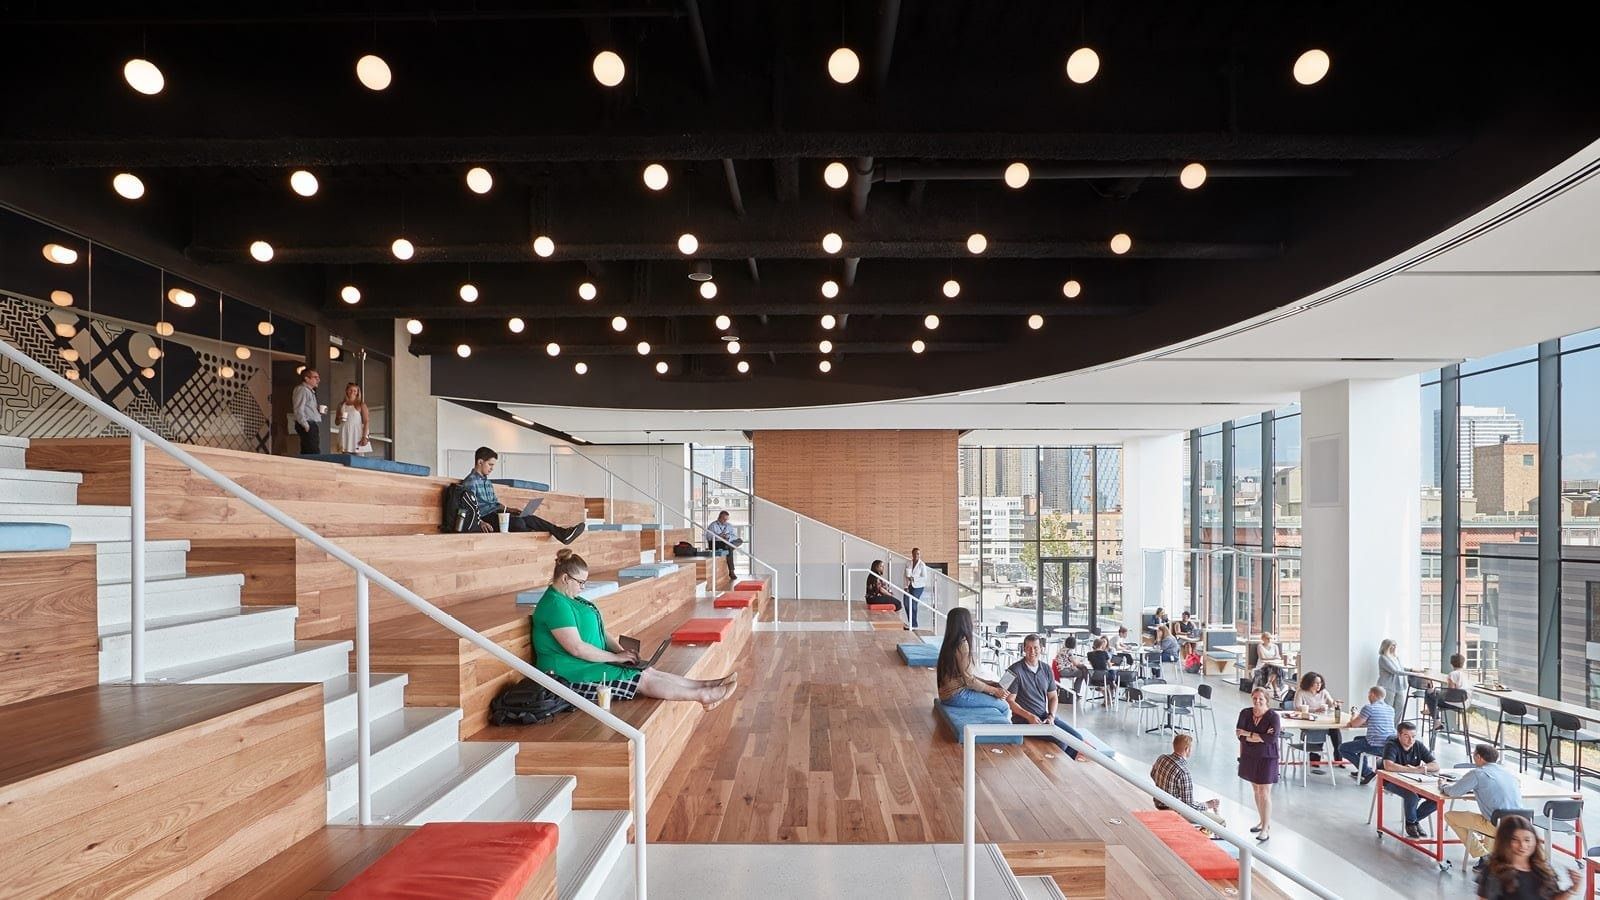 McDonald's $26.9B2025
 - 93
 Nutrien $26.9B2025
 - 96
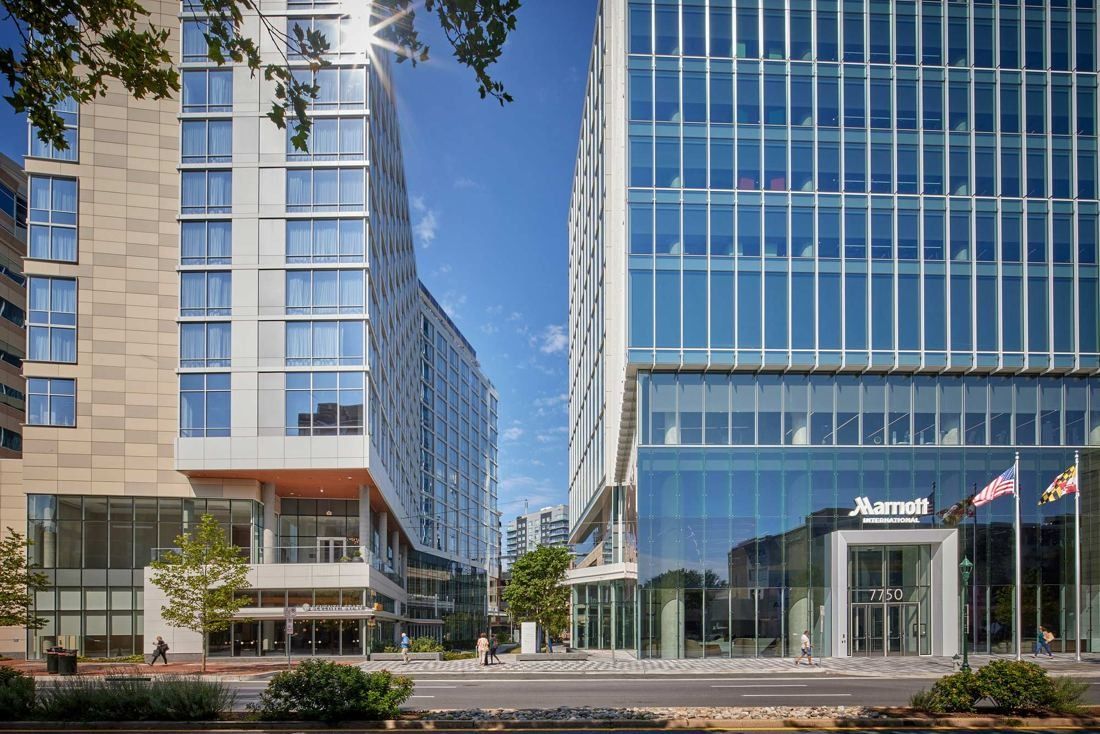 Marriott International $26.2BFY2025
 - 97
 3M $24.9B2025
 - 98
 Union Pacific $24.5B2025
 - 99
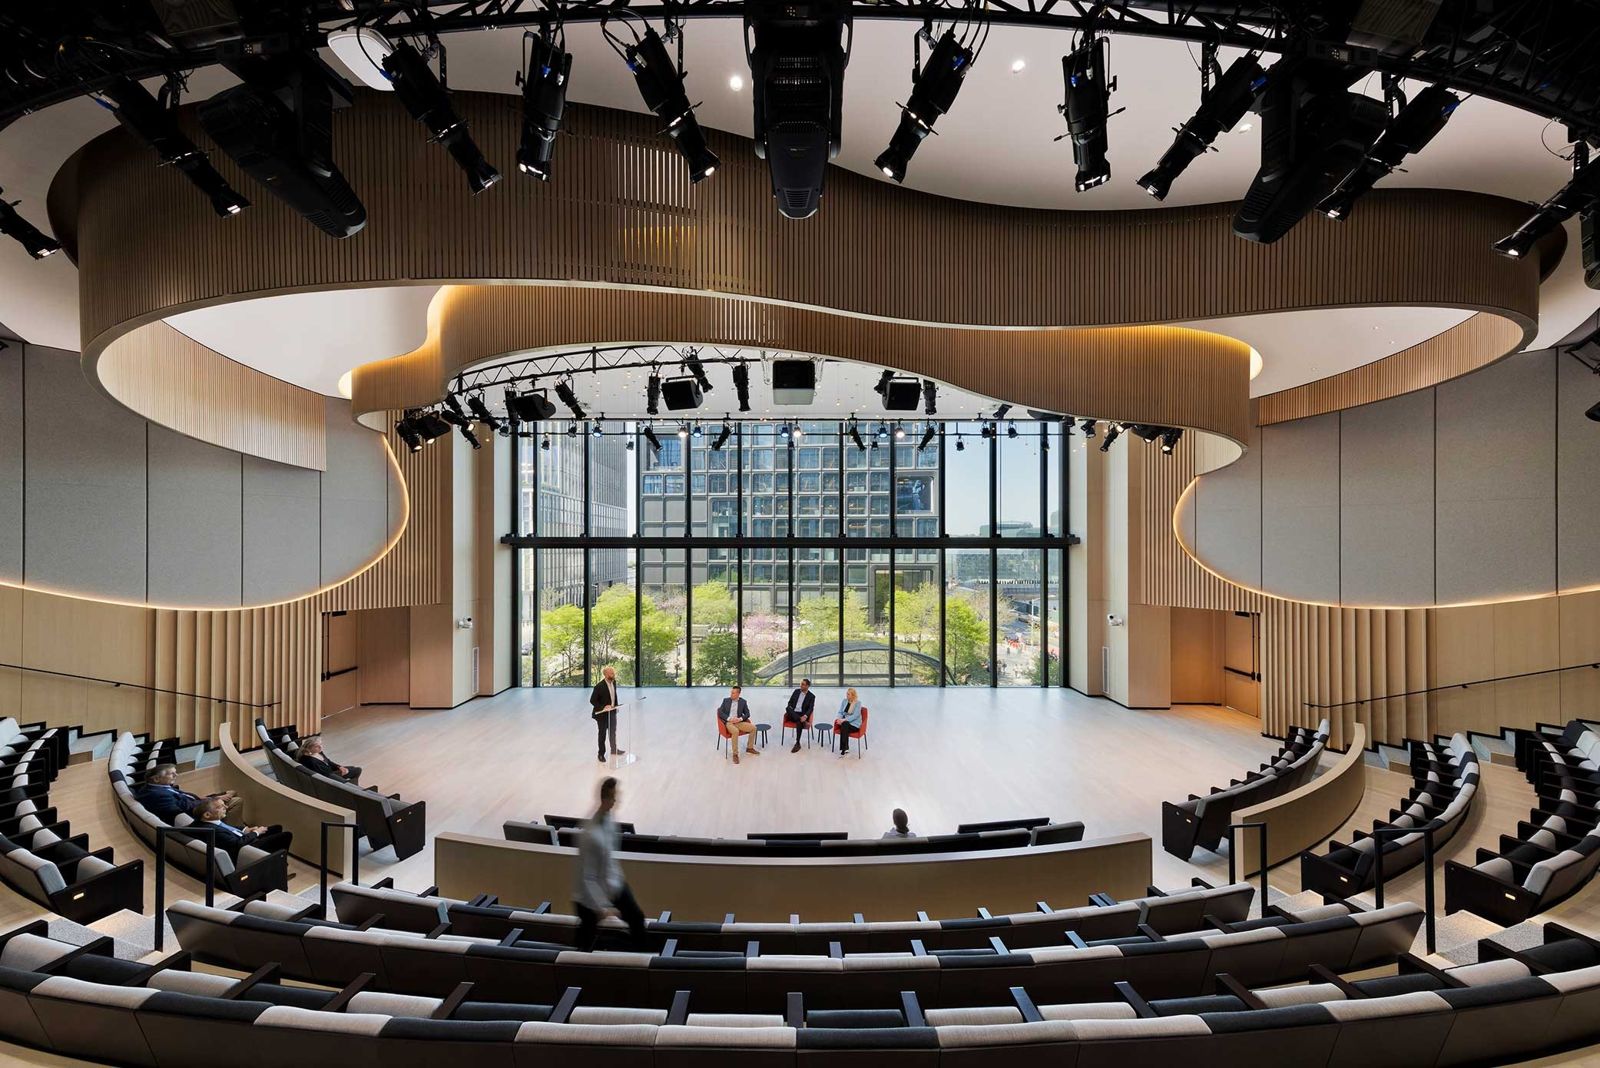 BlackRock $24.2B2025
 - 99
 Block $24.2B2025
 - 101
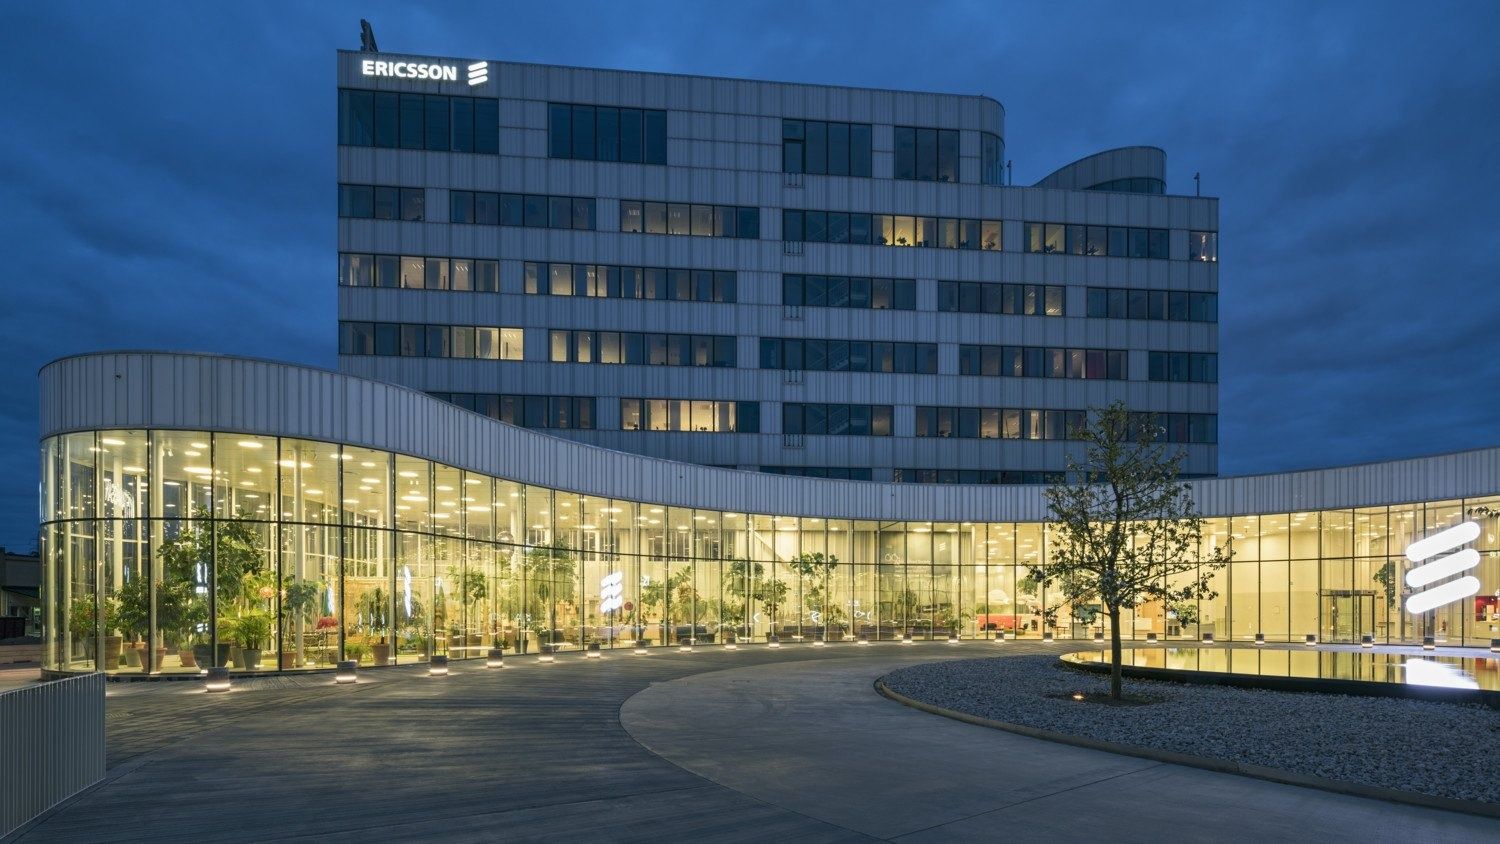 Ericsson ≈$23.9B2025
 - 102
 Adobe $23.8B2025
 - 103
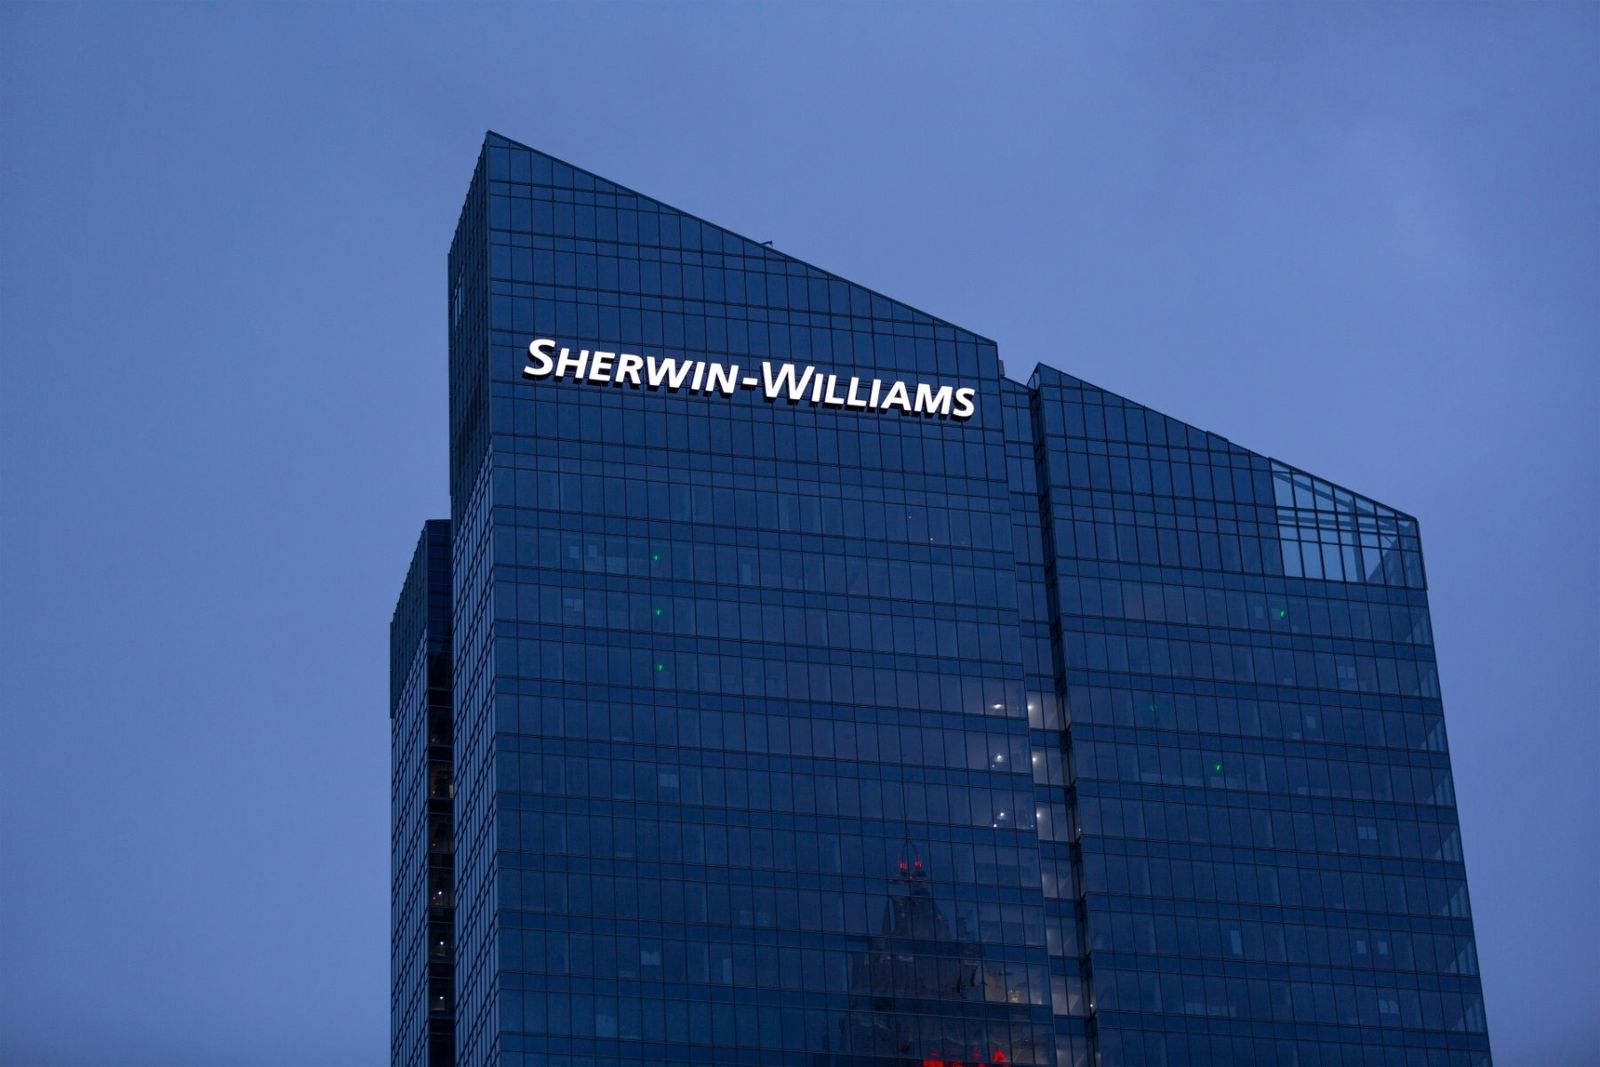 Sherwin-Williams $23.6B2025
 - 104
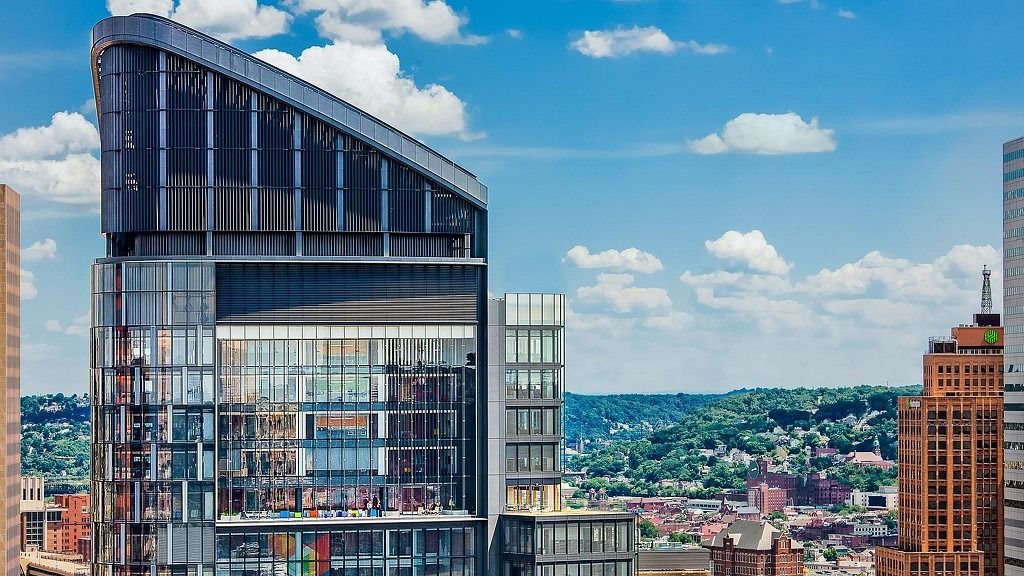 PNC Financial Services $23.1B2025
 - 105
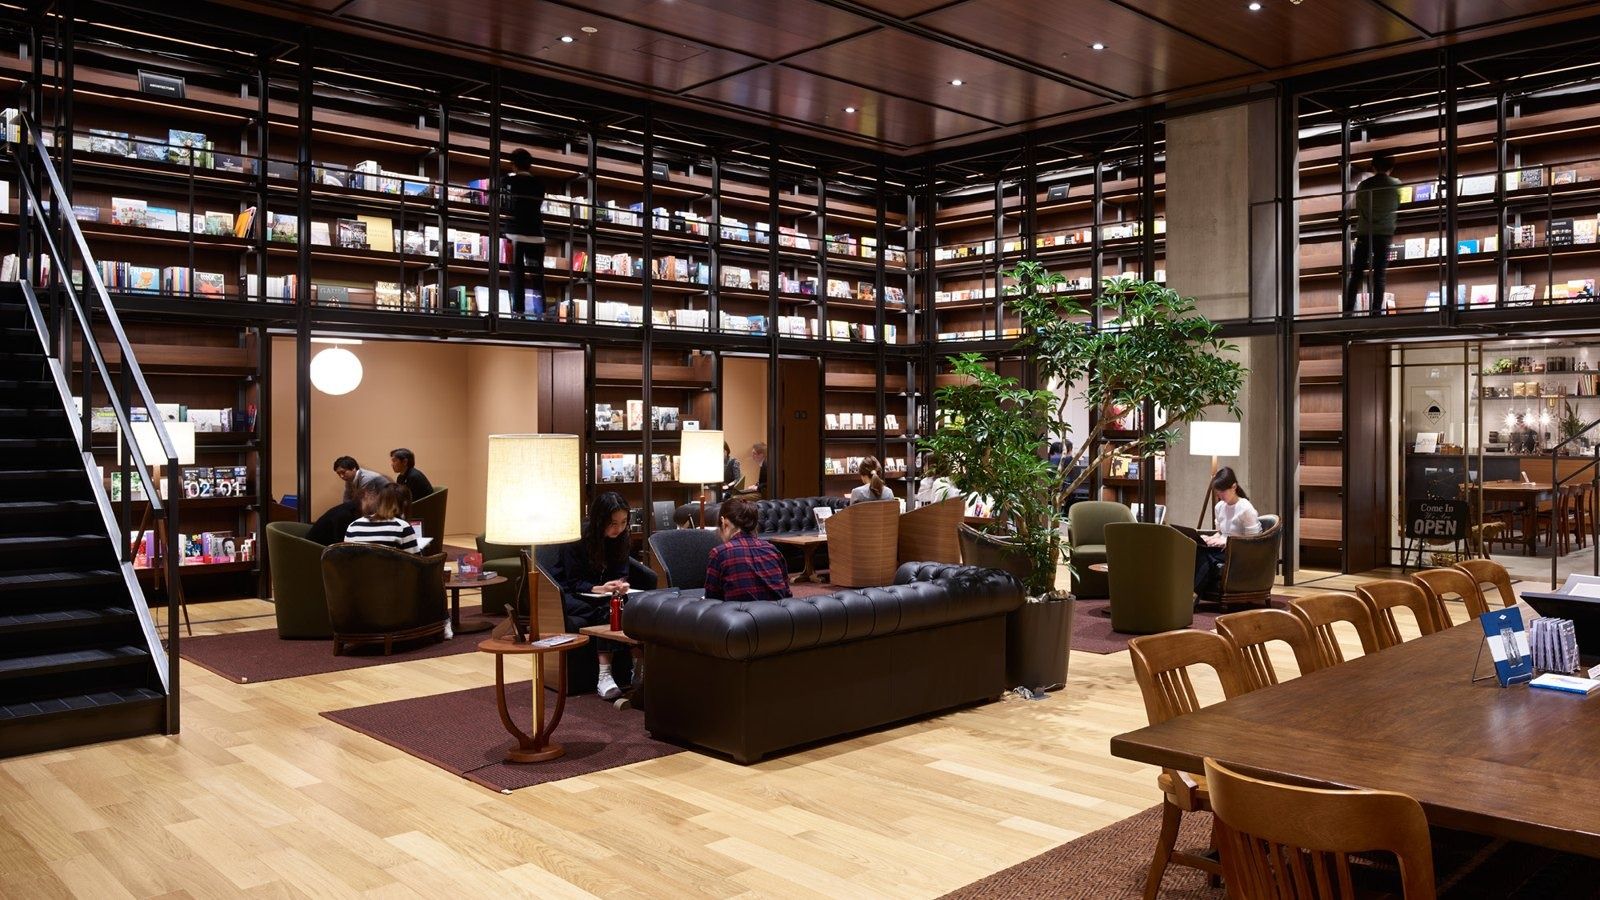 Fast Retailing (UNIQLO) ≈$22.9BFY2025
 - 106
 Group 1 Automotive $22.6B2025
 - 107
 Halliburton $22.2B2025
 - 108
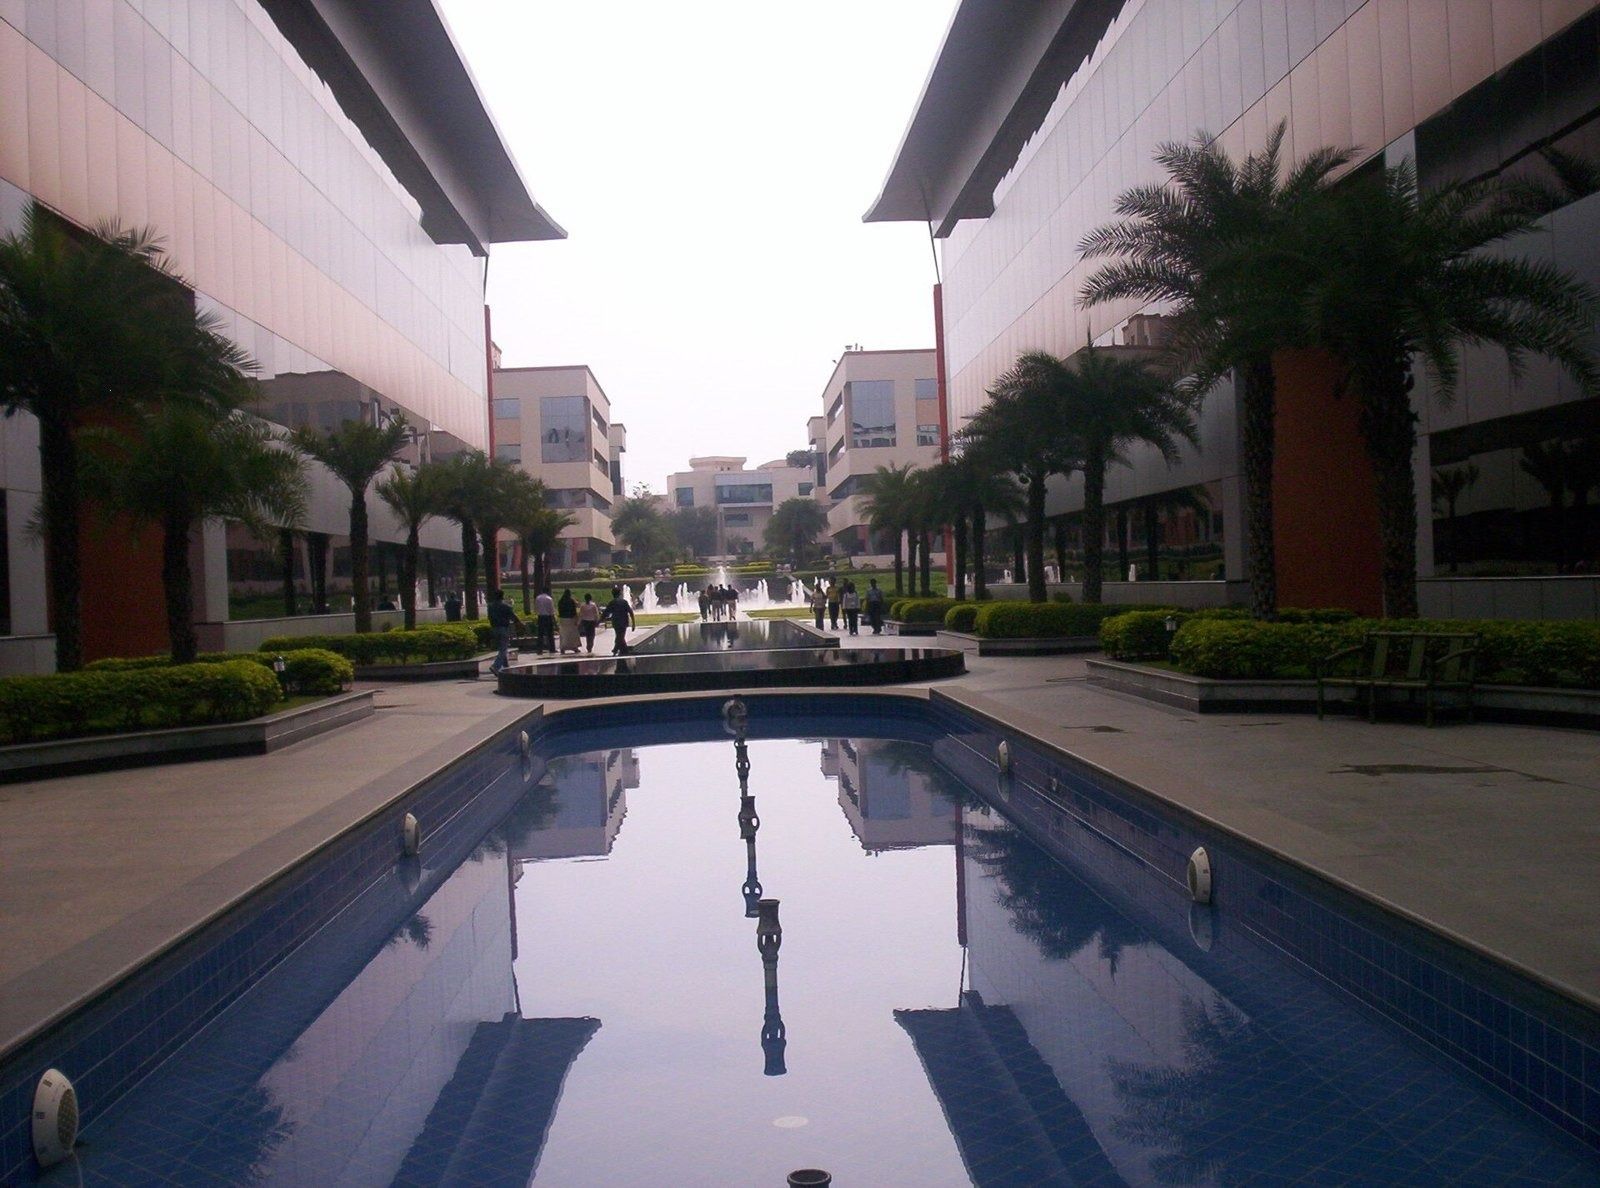 Infosys $20.2BFY2026
 - 109
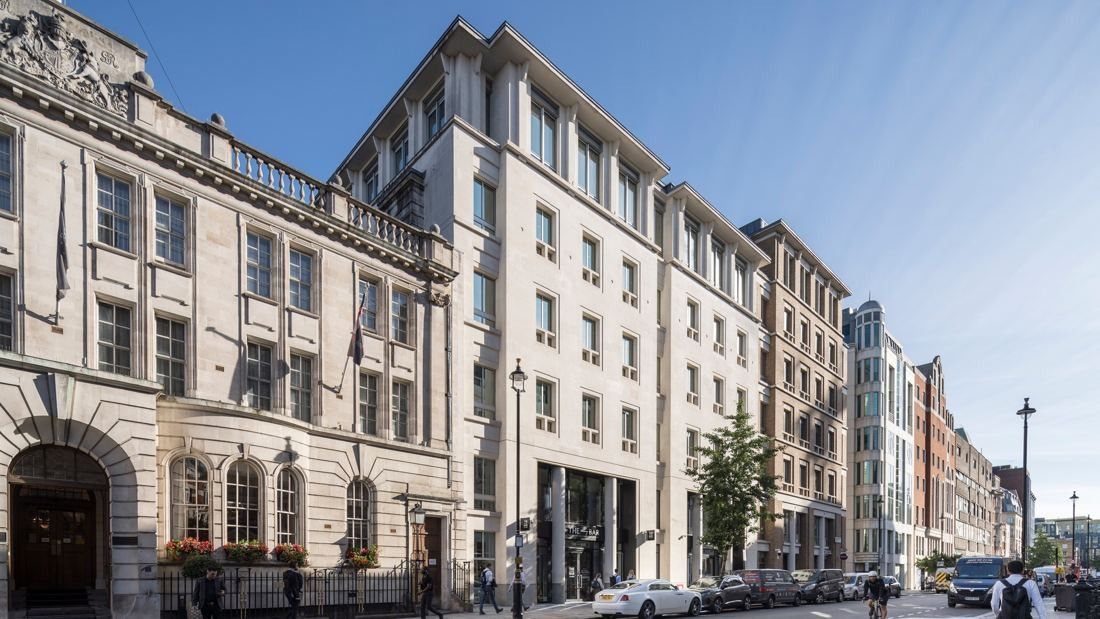 Diageo $19.6BFY2026
 - 110
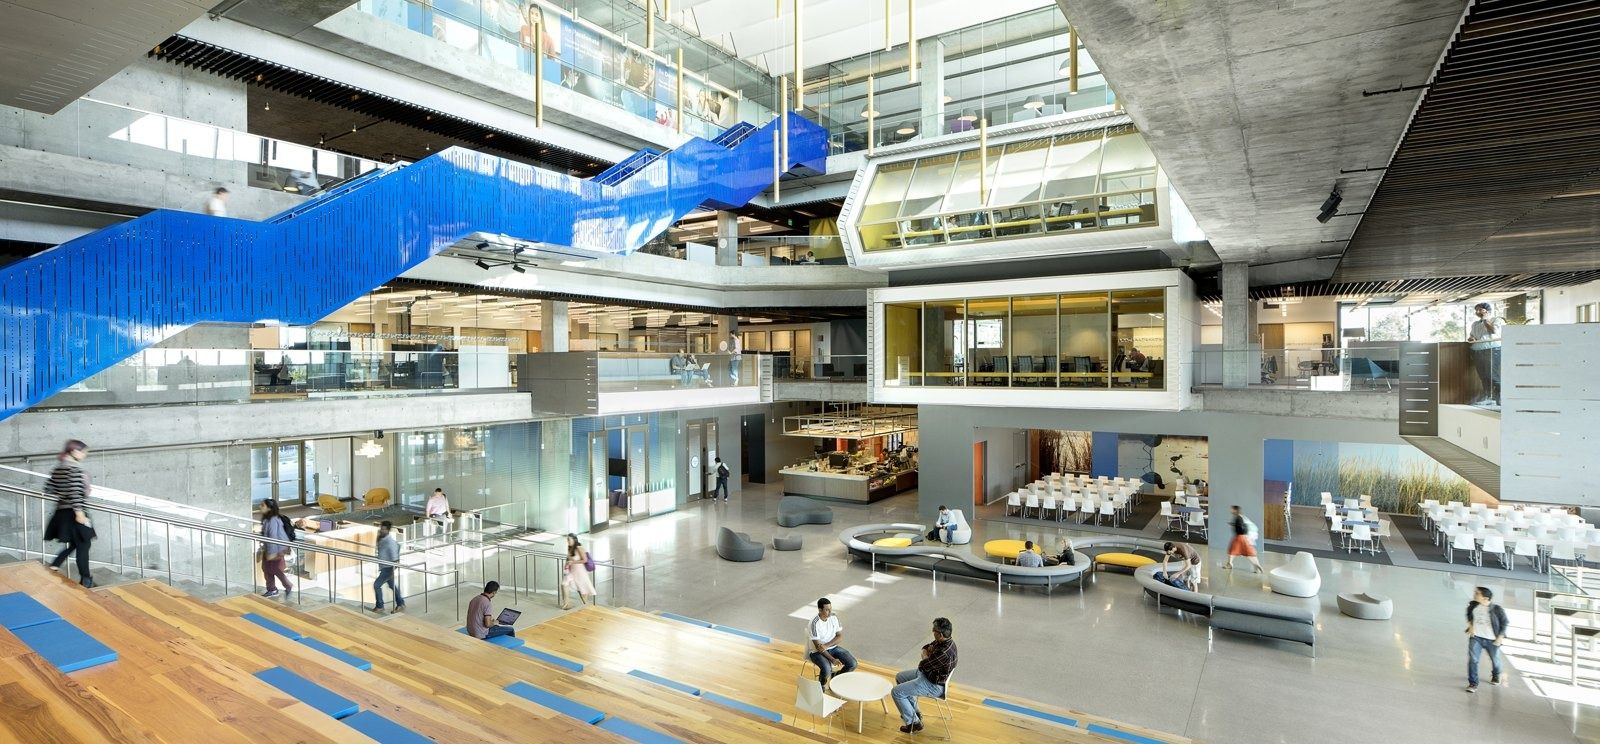 Intuit $18.8B2025
 - 111
 Aramark $18.5B2025
 - 112
 General Mills $18.4BFY2026
 - 113
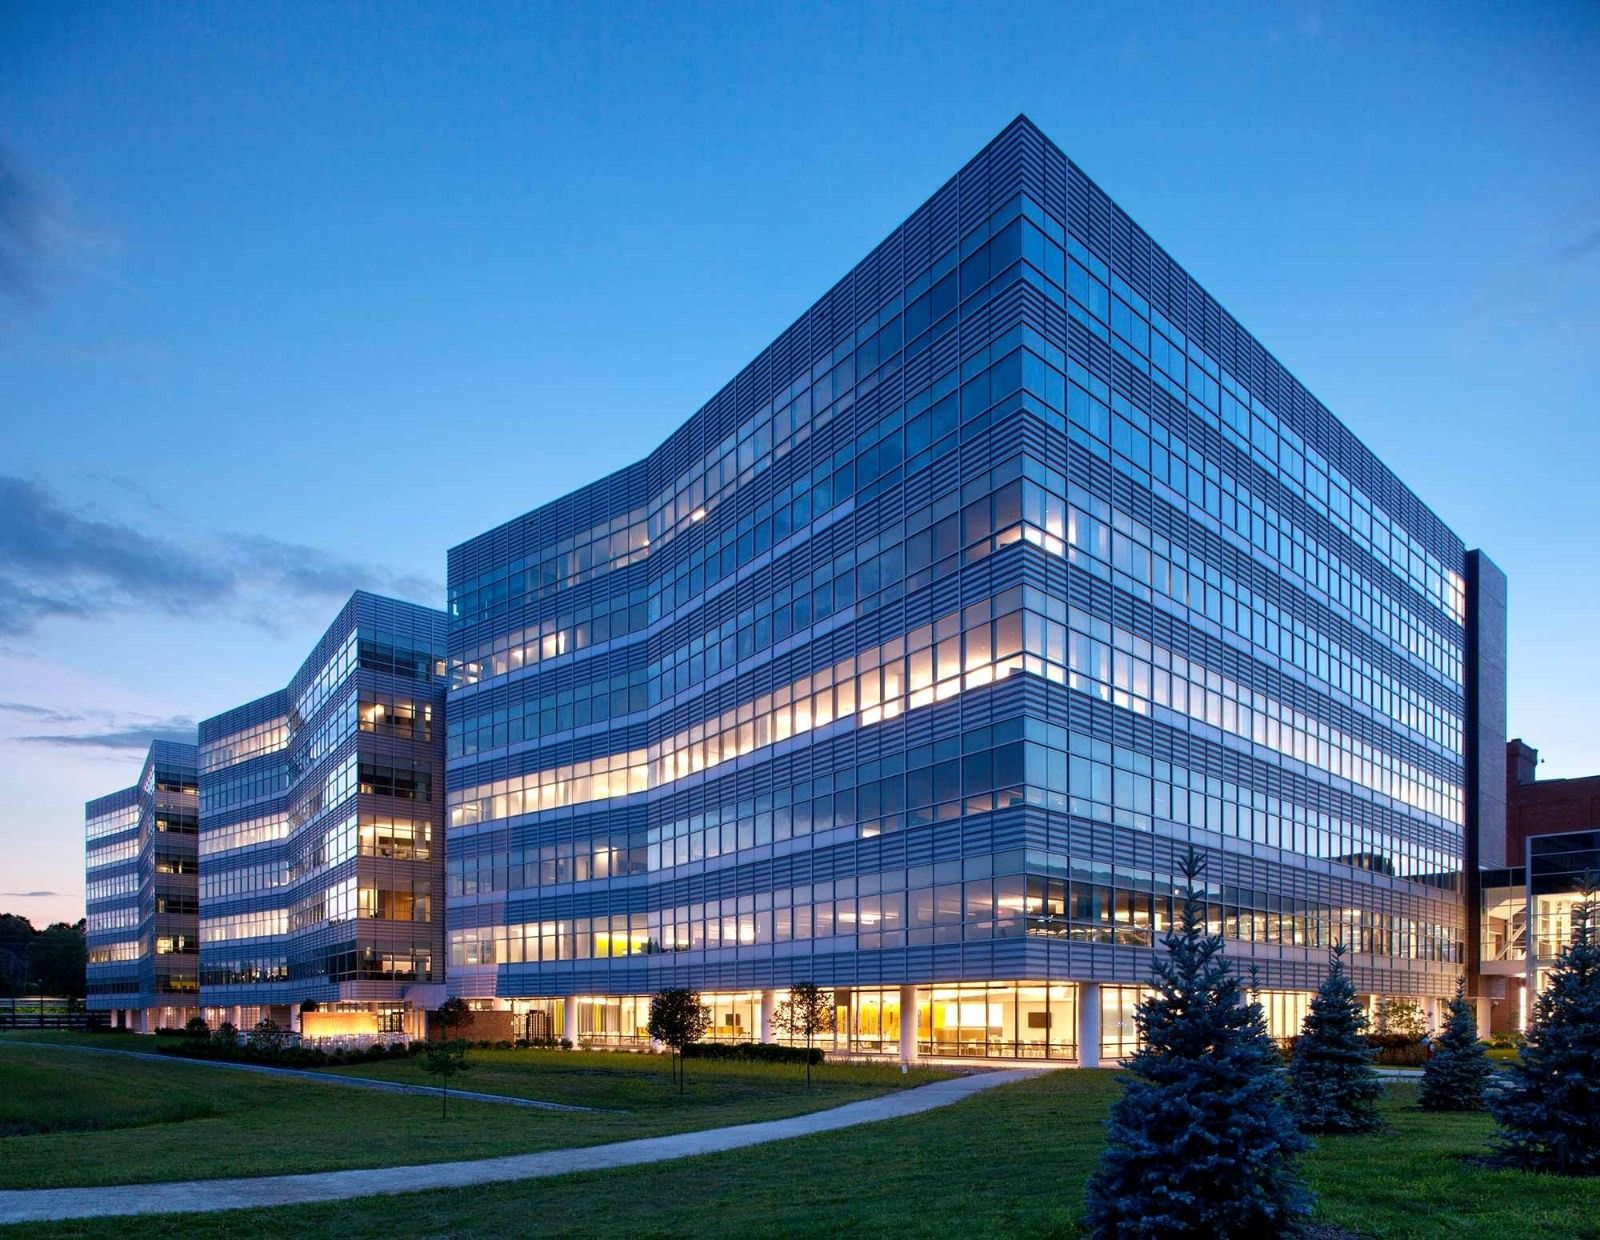 Goodyear $18.3B2025
 - 114
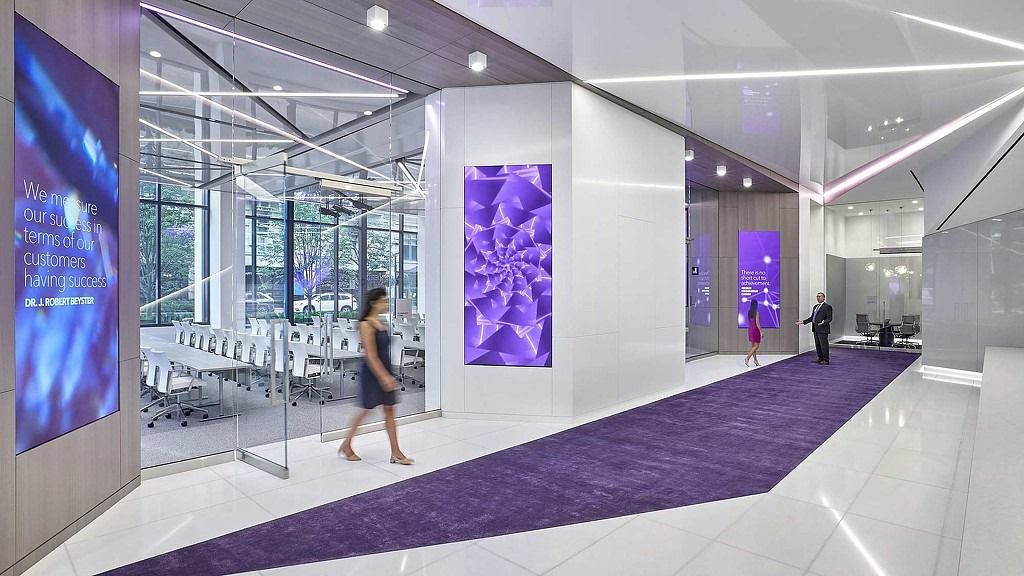 Leidos $17.2B2025
 - 115
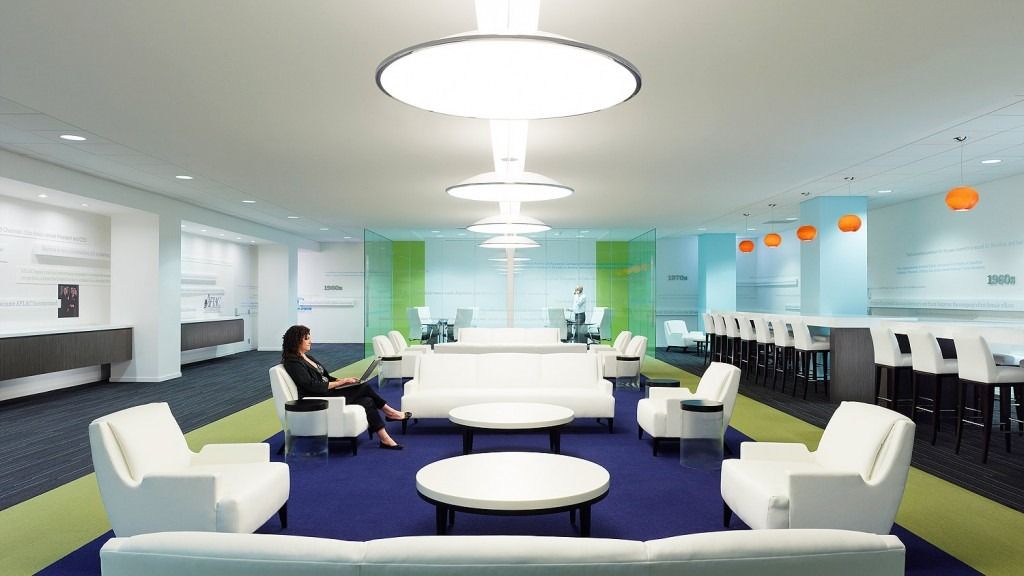 Aflac $17.2B2025
 - 116
 Keurig Dr Pepper $16.6B2025
 - 117
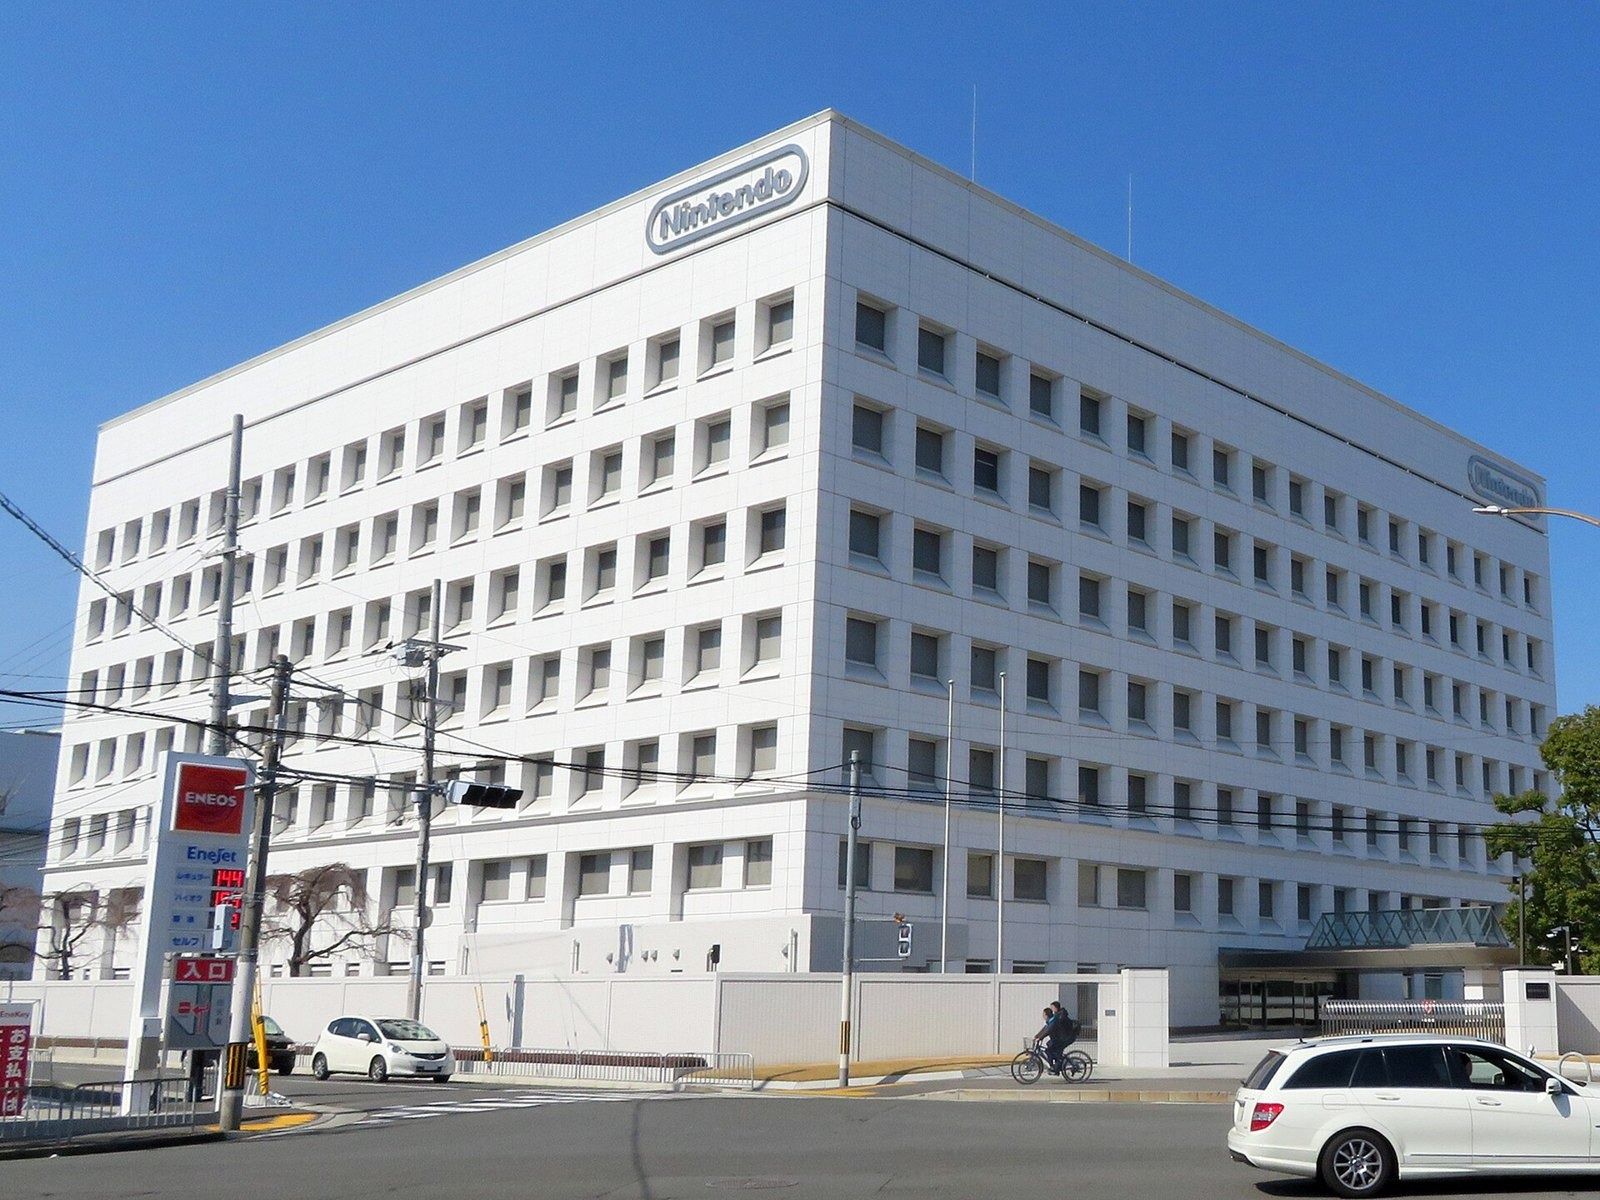 Nintendo ≈$15.3BFY ended Mar 2026
 - 118
 The Estée Lauder Companies $15.1BFY2026
 - 119
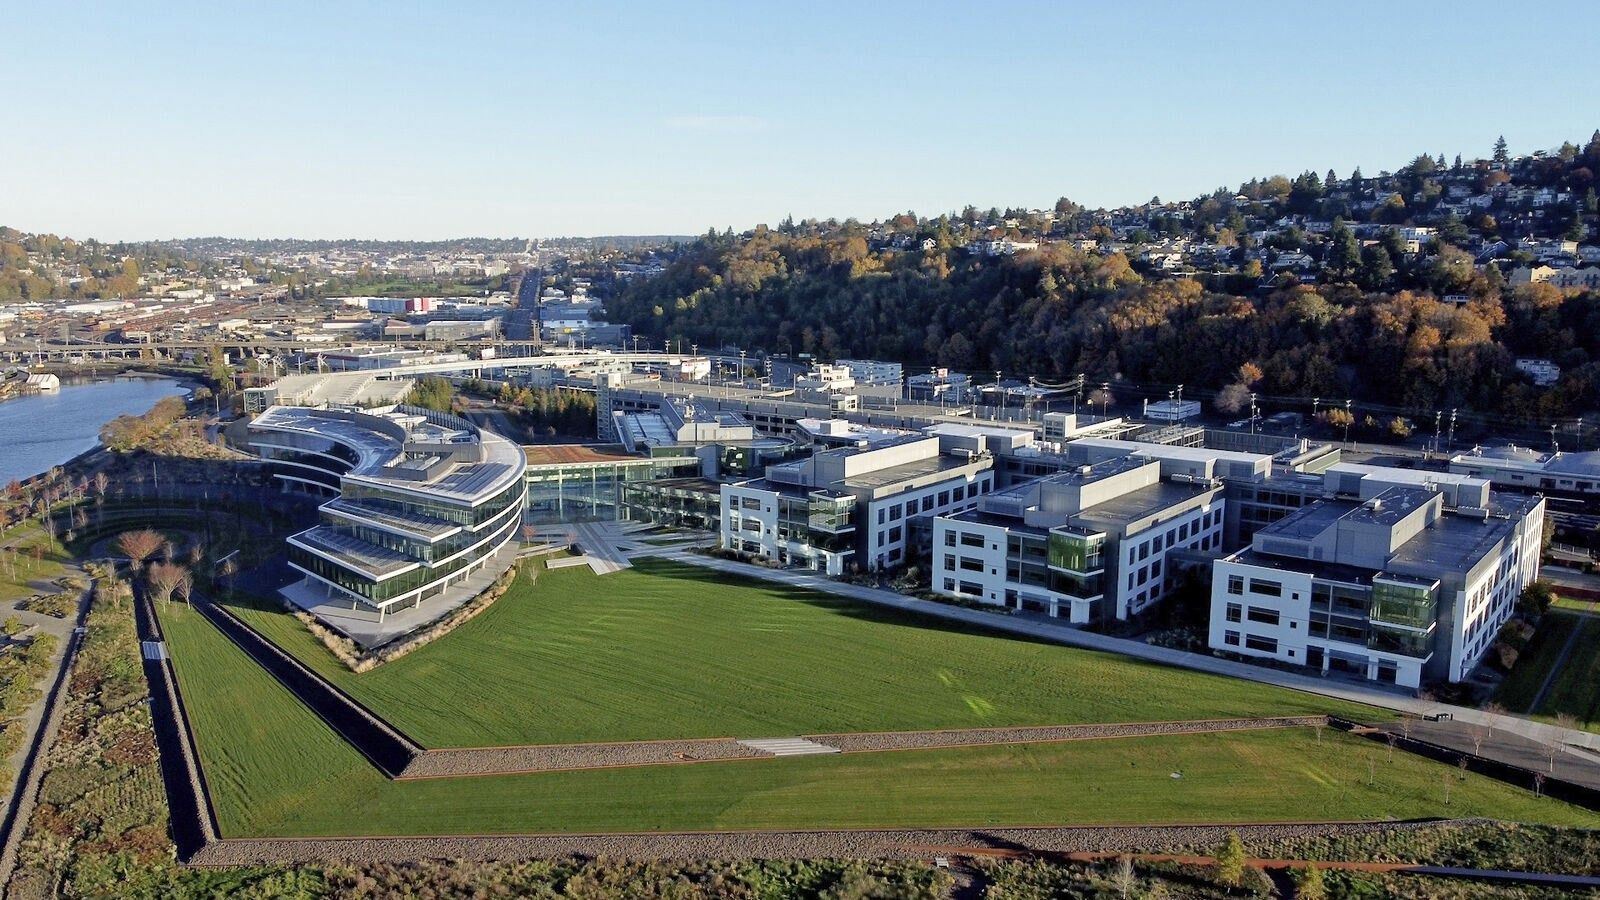 Expedia Group $14.7B2025
 - 120
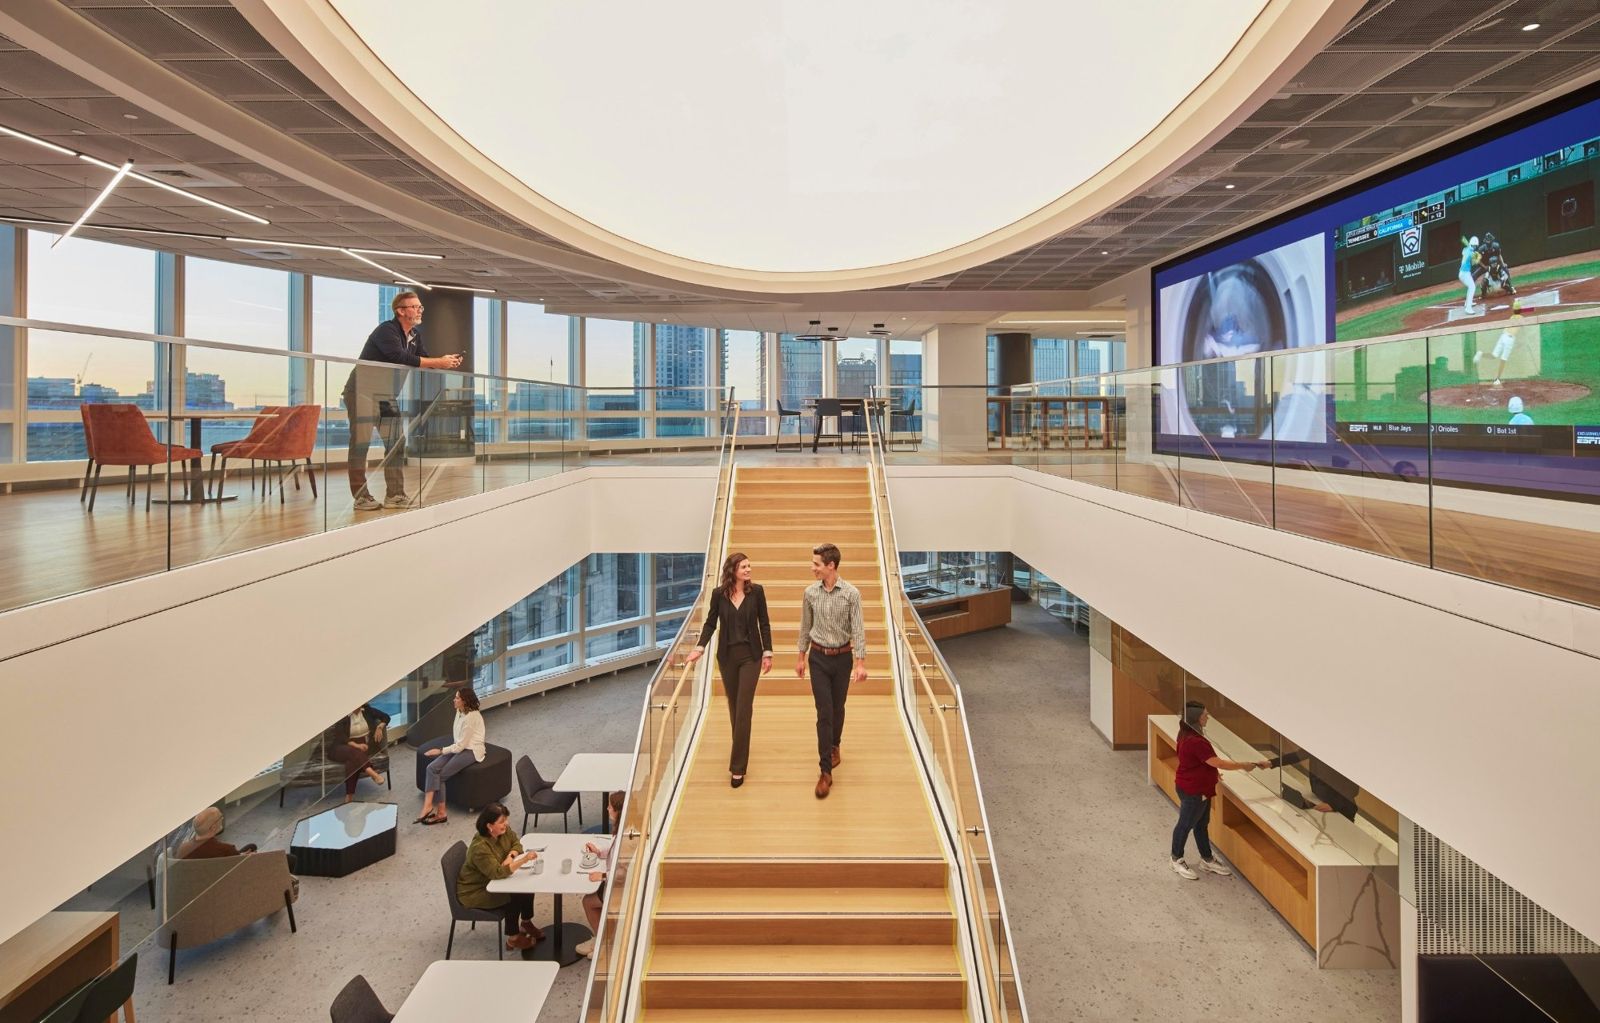 State Street $13.9B2025
 - 121
 DoorDash $13.7B2025
 - 122
 ServiceNow $13.3B2025
 - 123
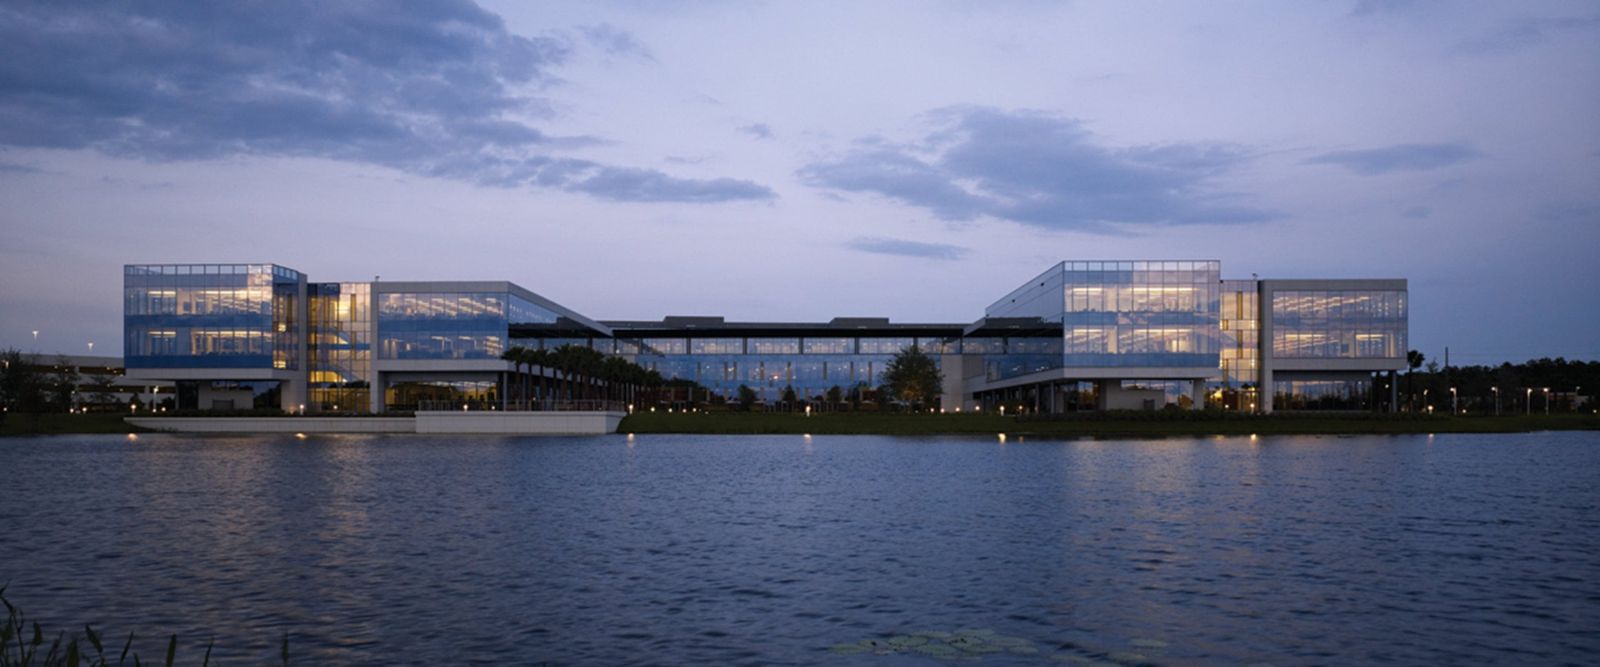 Darden Restaurants $13.2B2025
 - 124
 Molson Coors $13.0B2025
 - 125
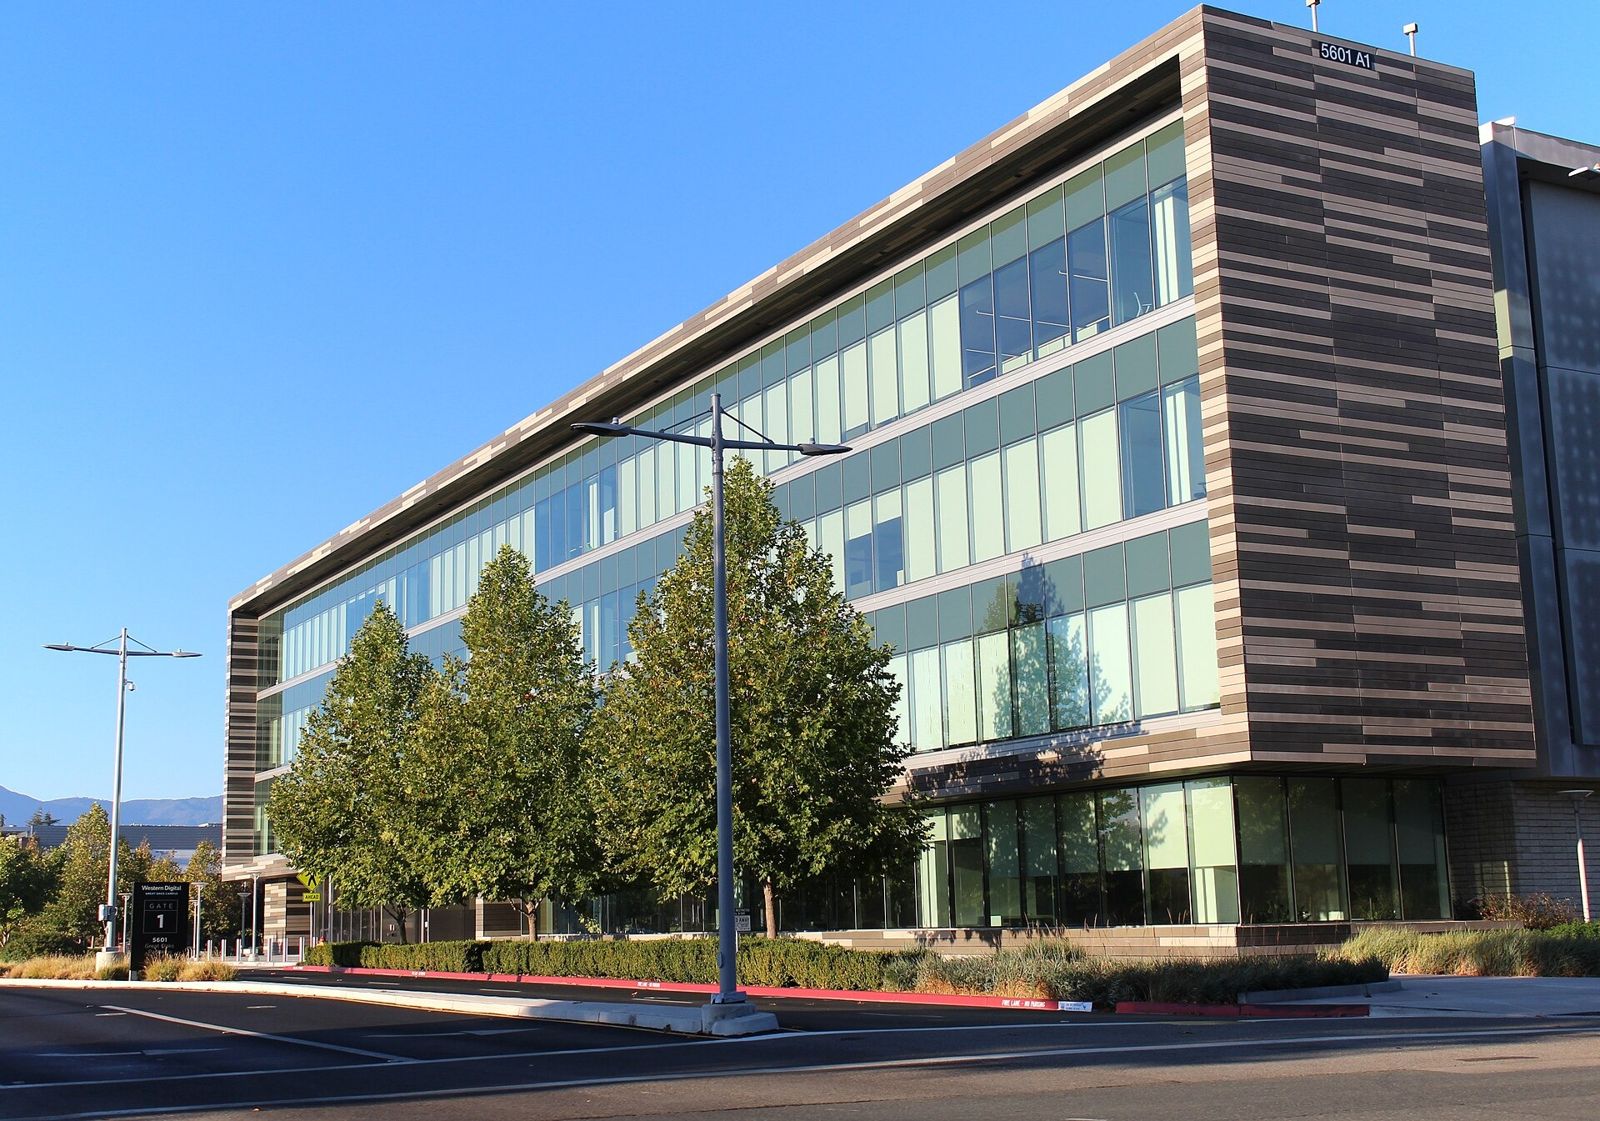 Western Digital $12.9B2026
 - 126
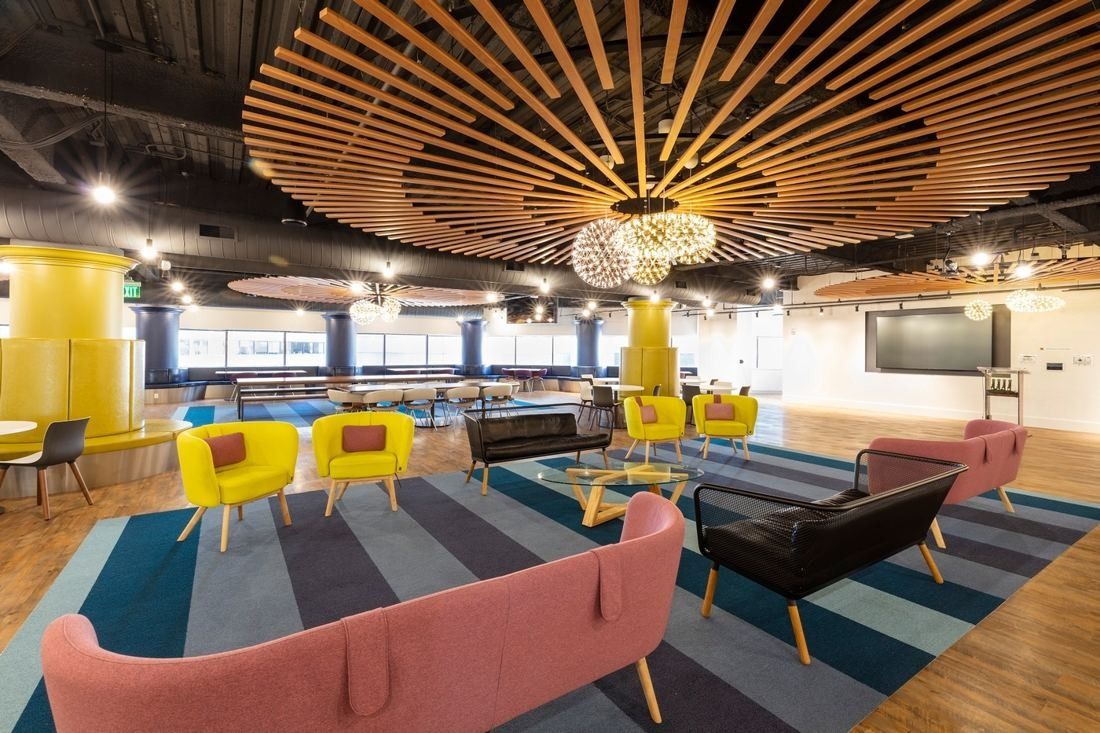 Wayfair $12.5BFY2025
 - 127
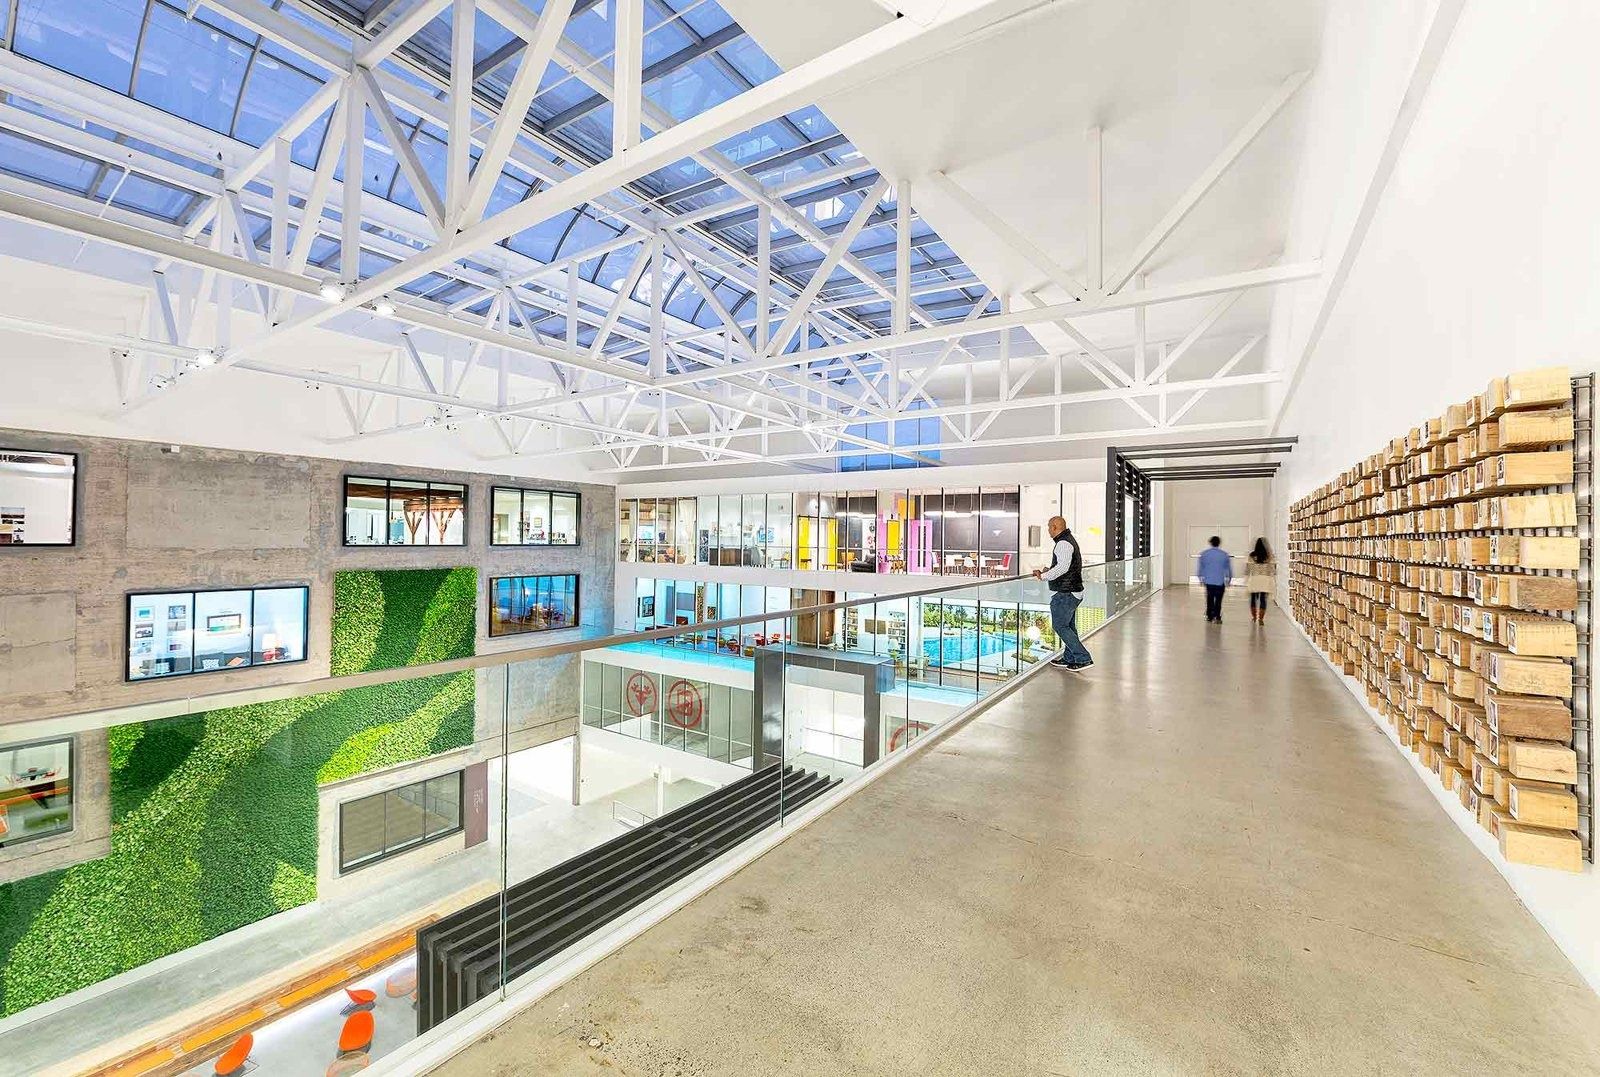 Airbnb $12.2B2025
 - 127
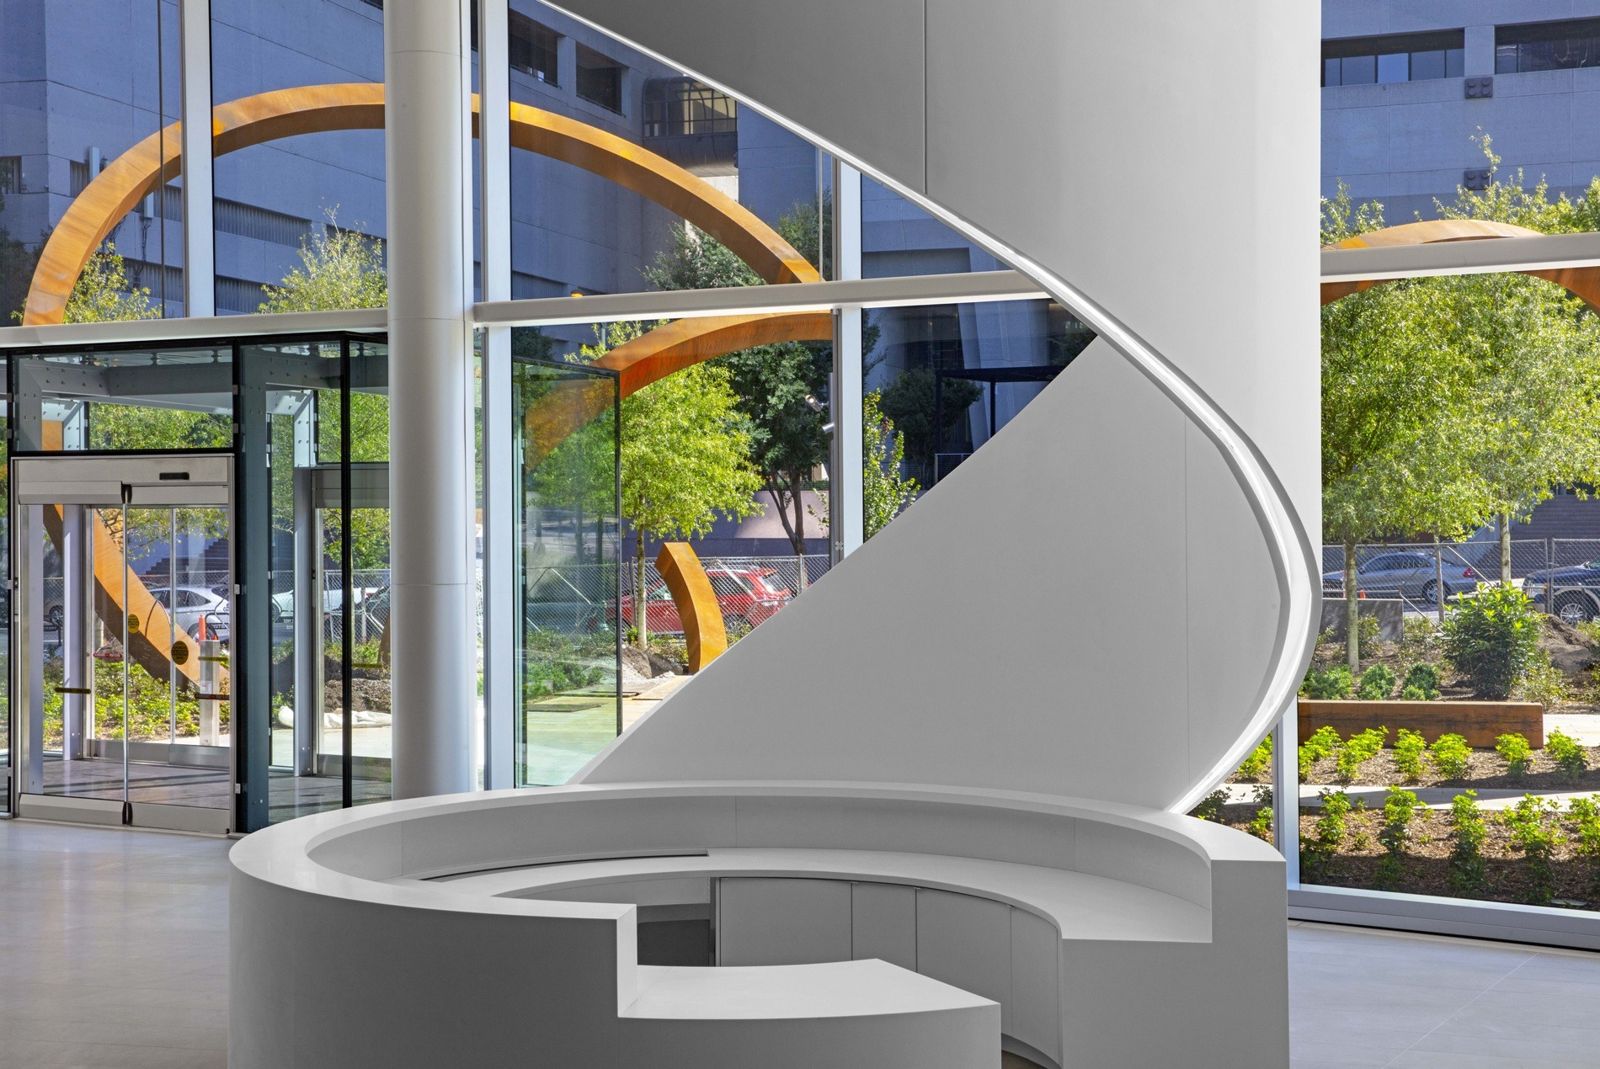 Norfolk Southern $12.2B2025
 - 129
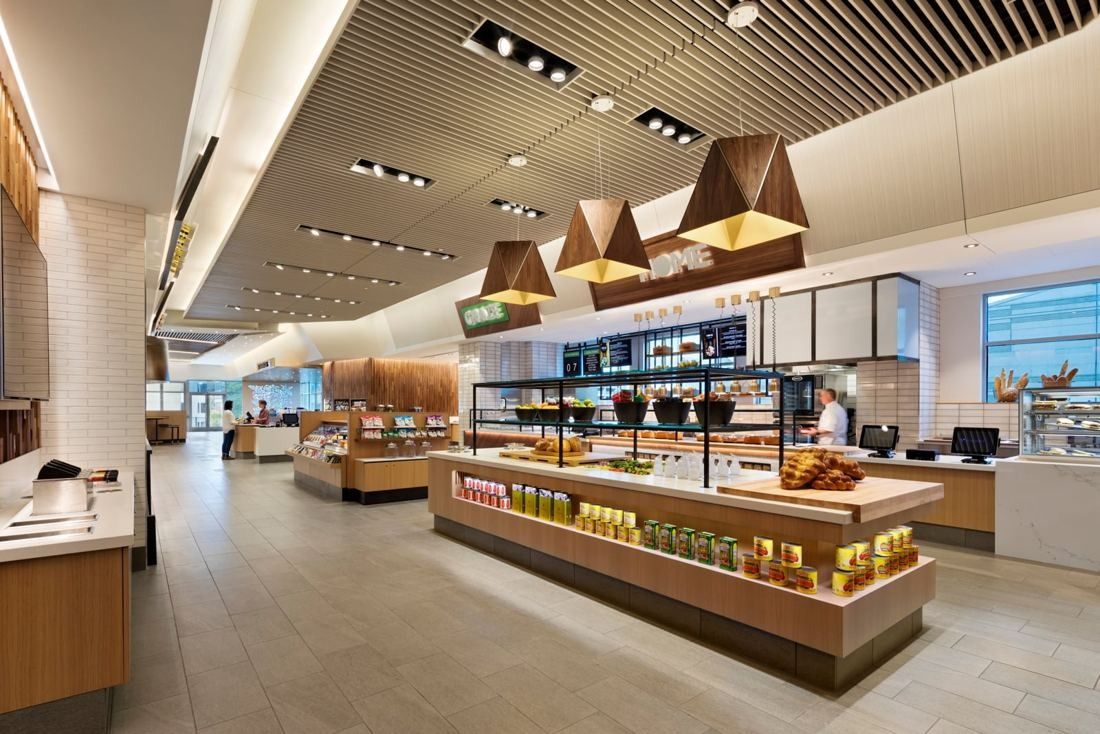 Hilton $12.0BFY2025
 - 130
 Shopify $11.6B2025
 - 131
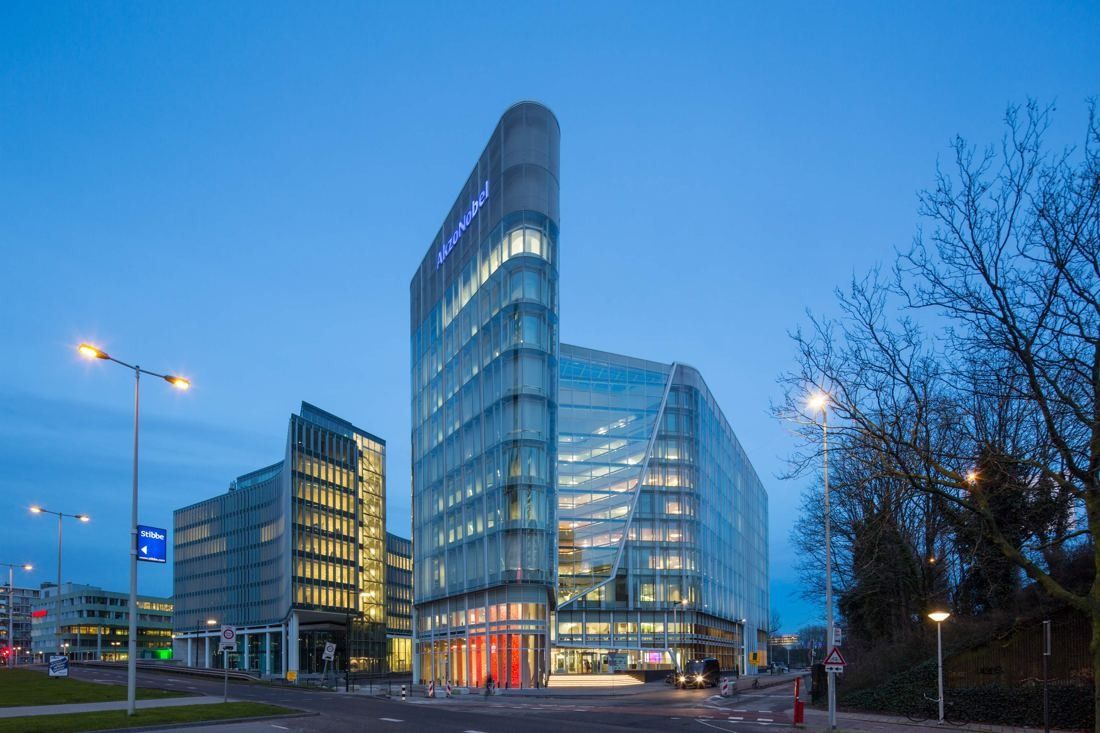 AkzoNobel ≈$11.5B2025
 - 132
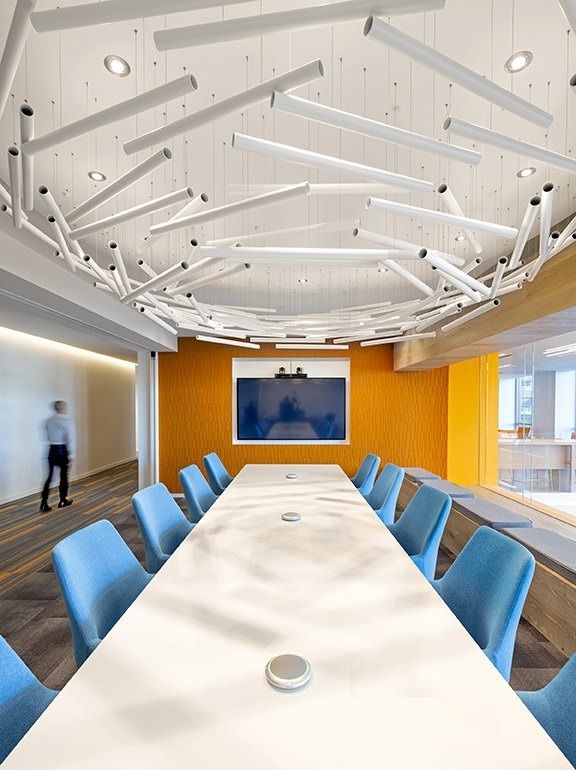 Palo Alto Networks $11.5BFY2026
 - 133
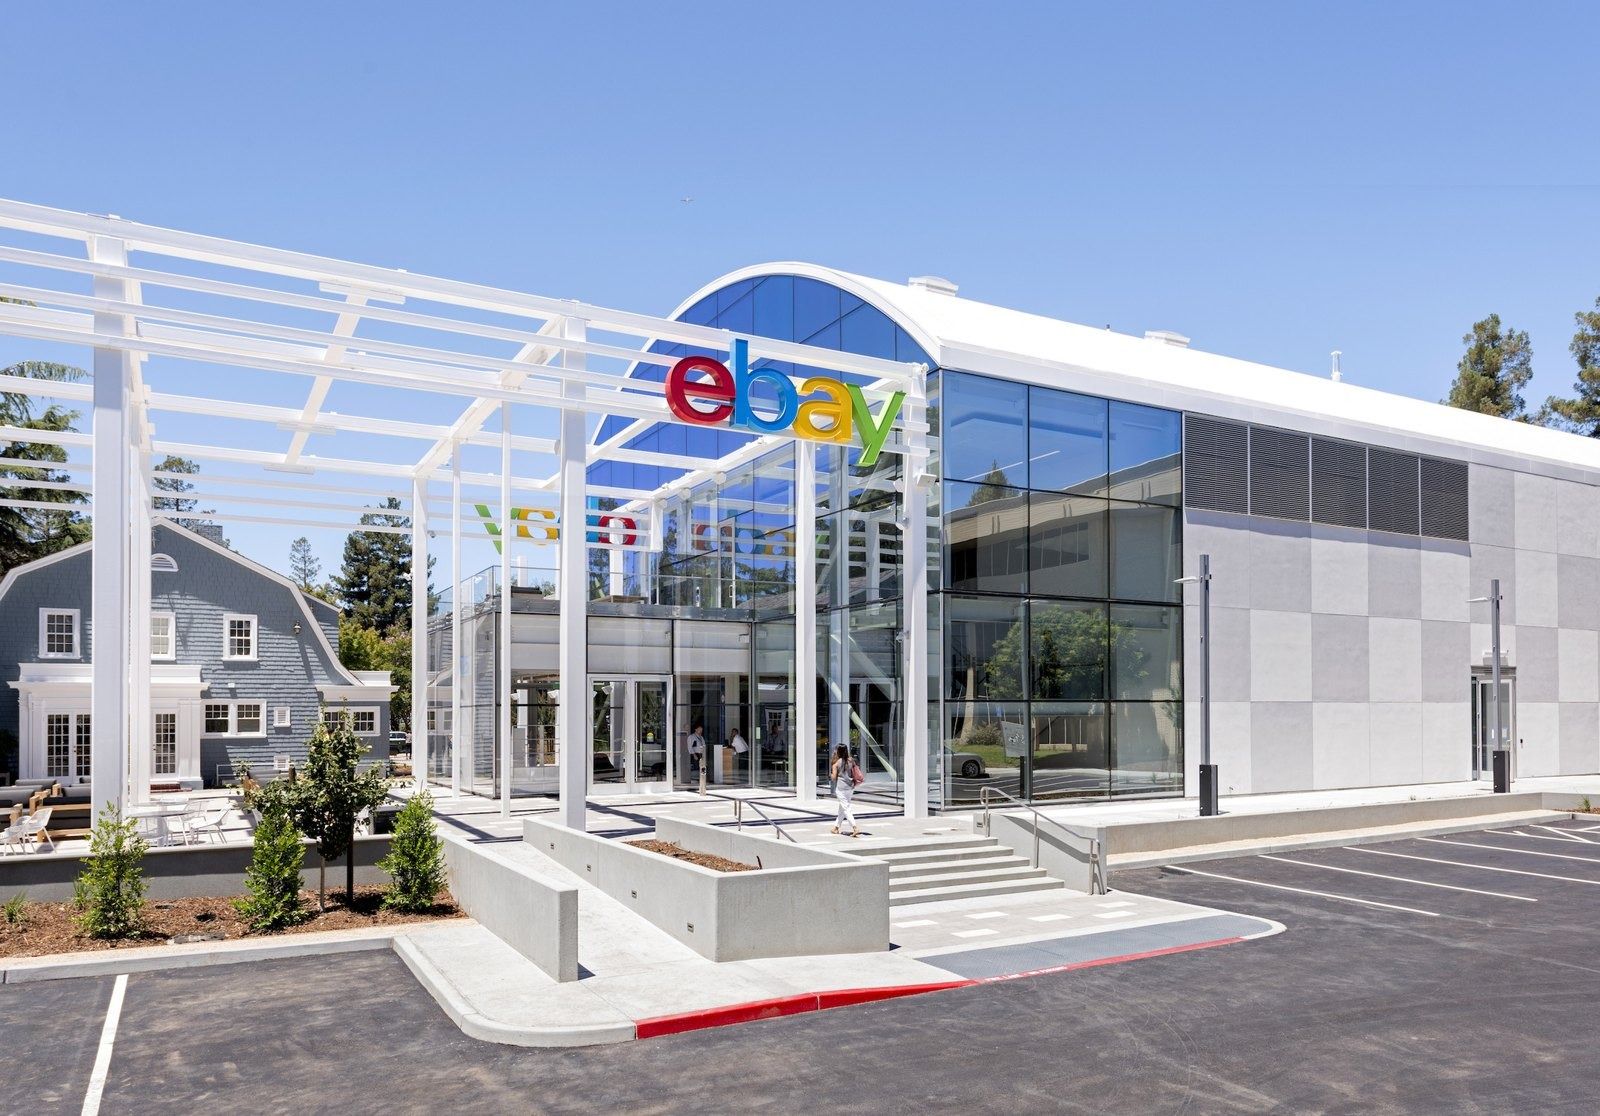 eBay $11.1B2025
 - 133
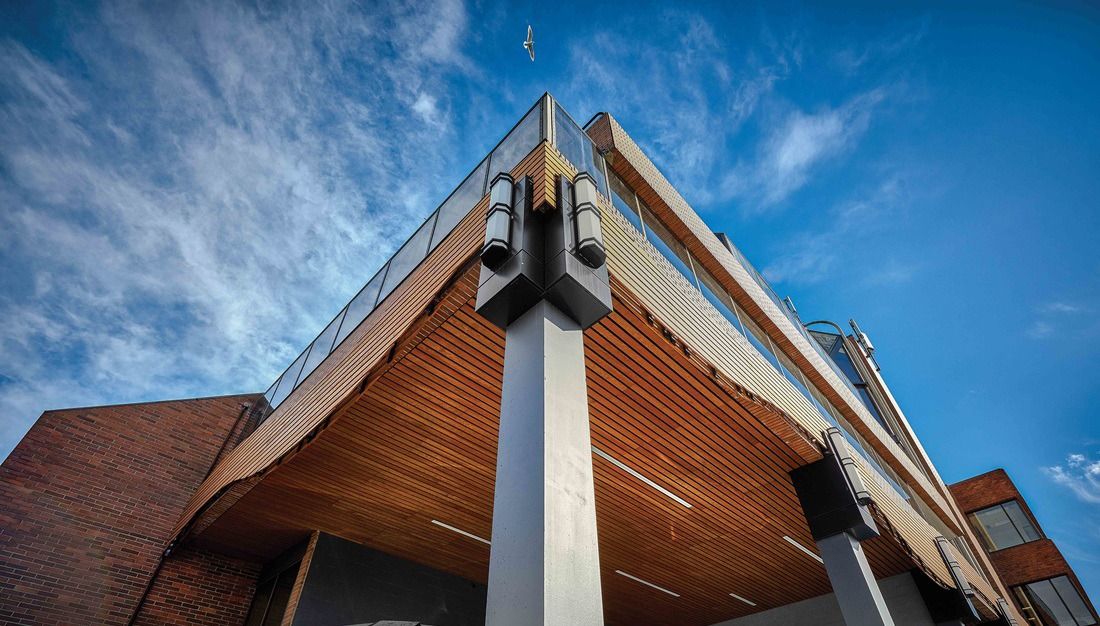 lululemon athletica $11.1BFY2025
 - 135
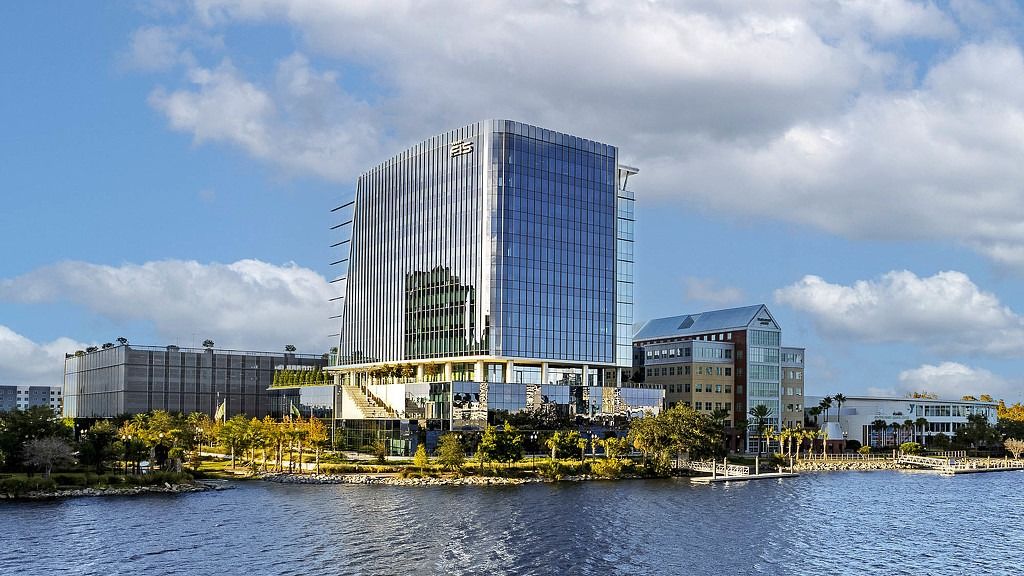 FIS $10.7B2025
 - 136
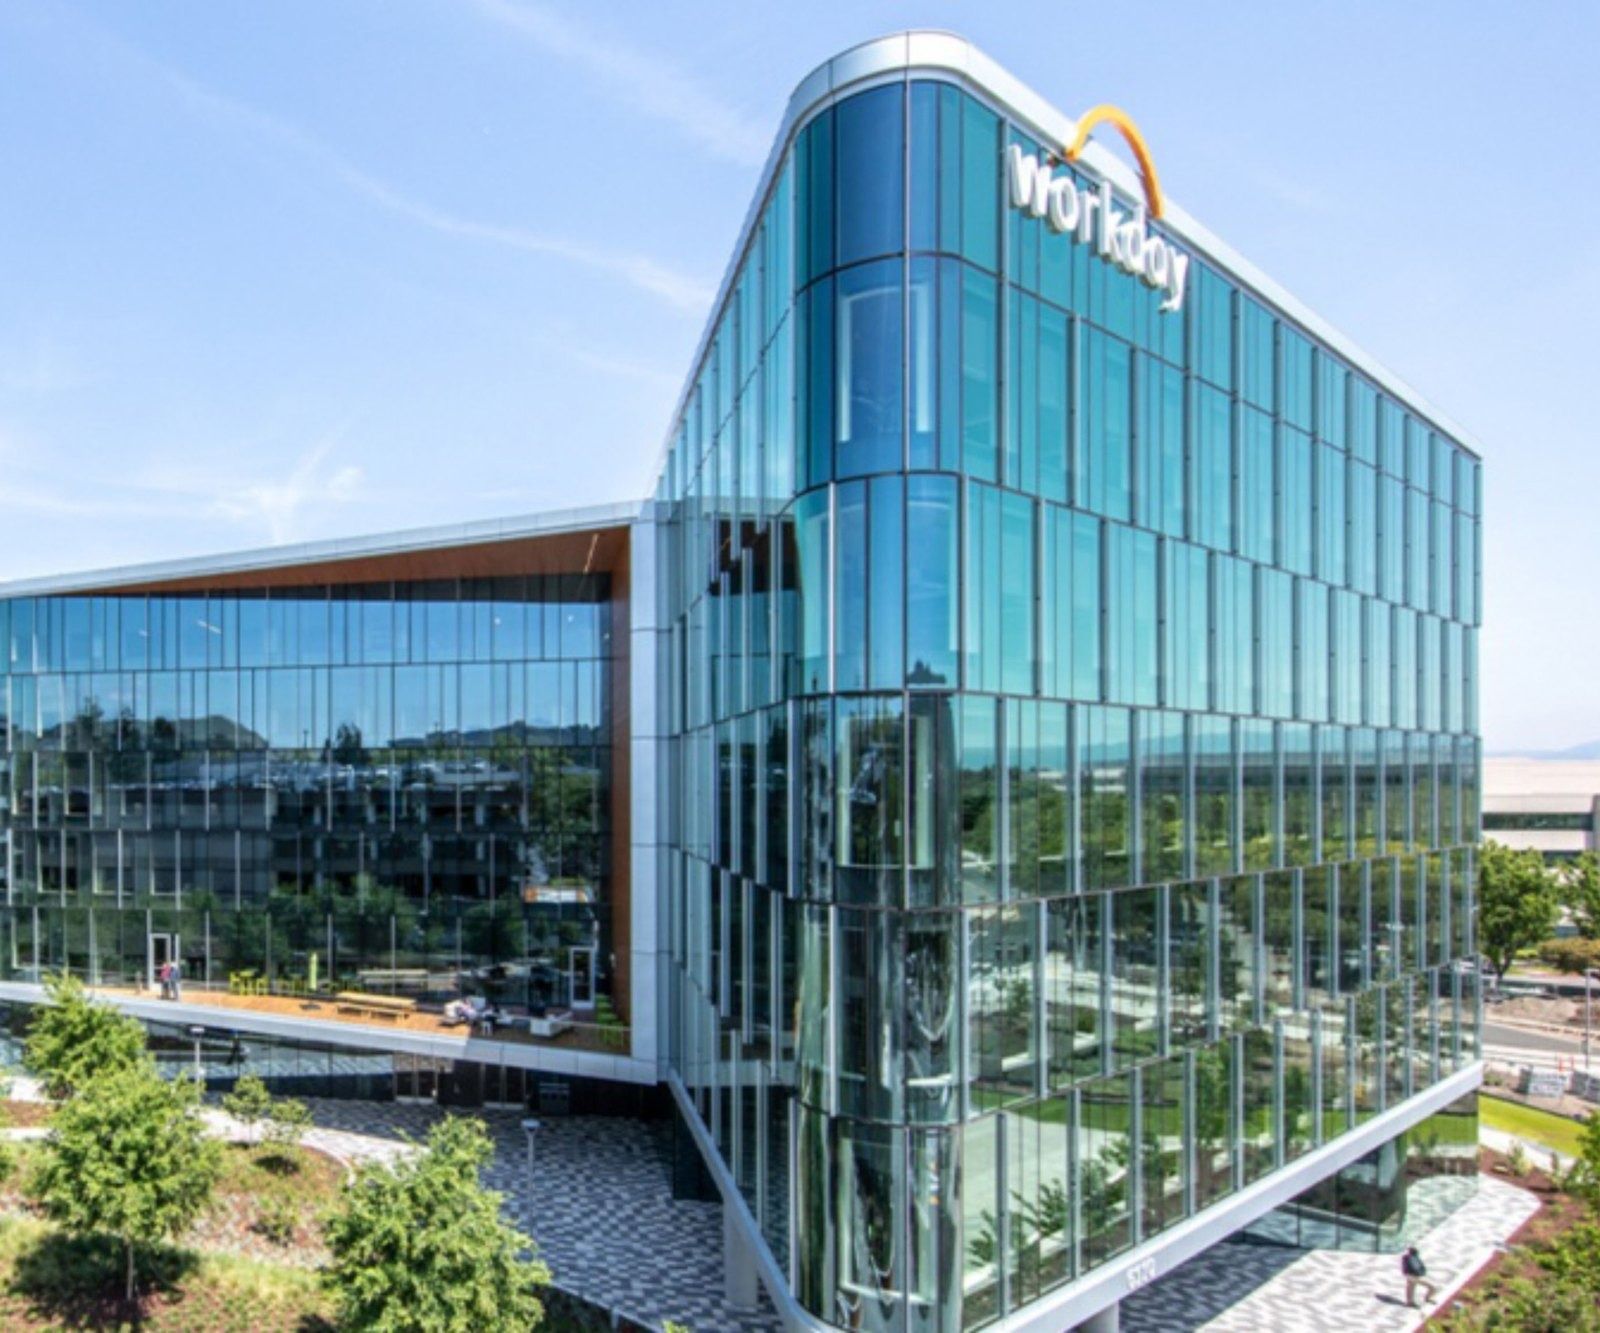 Workday $9.6BFY2026
 - 137
 Prologis $8.8B2025
 - 138
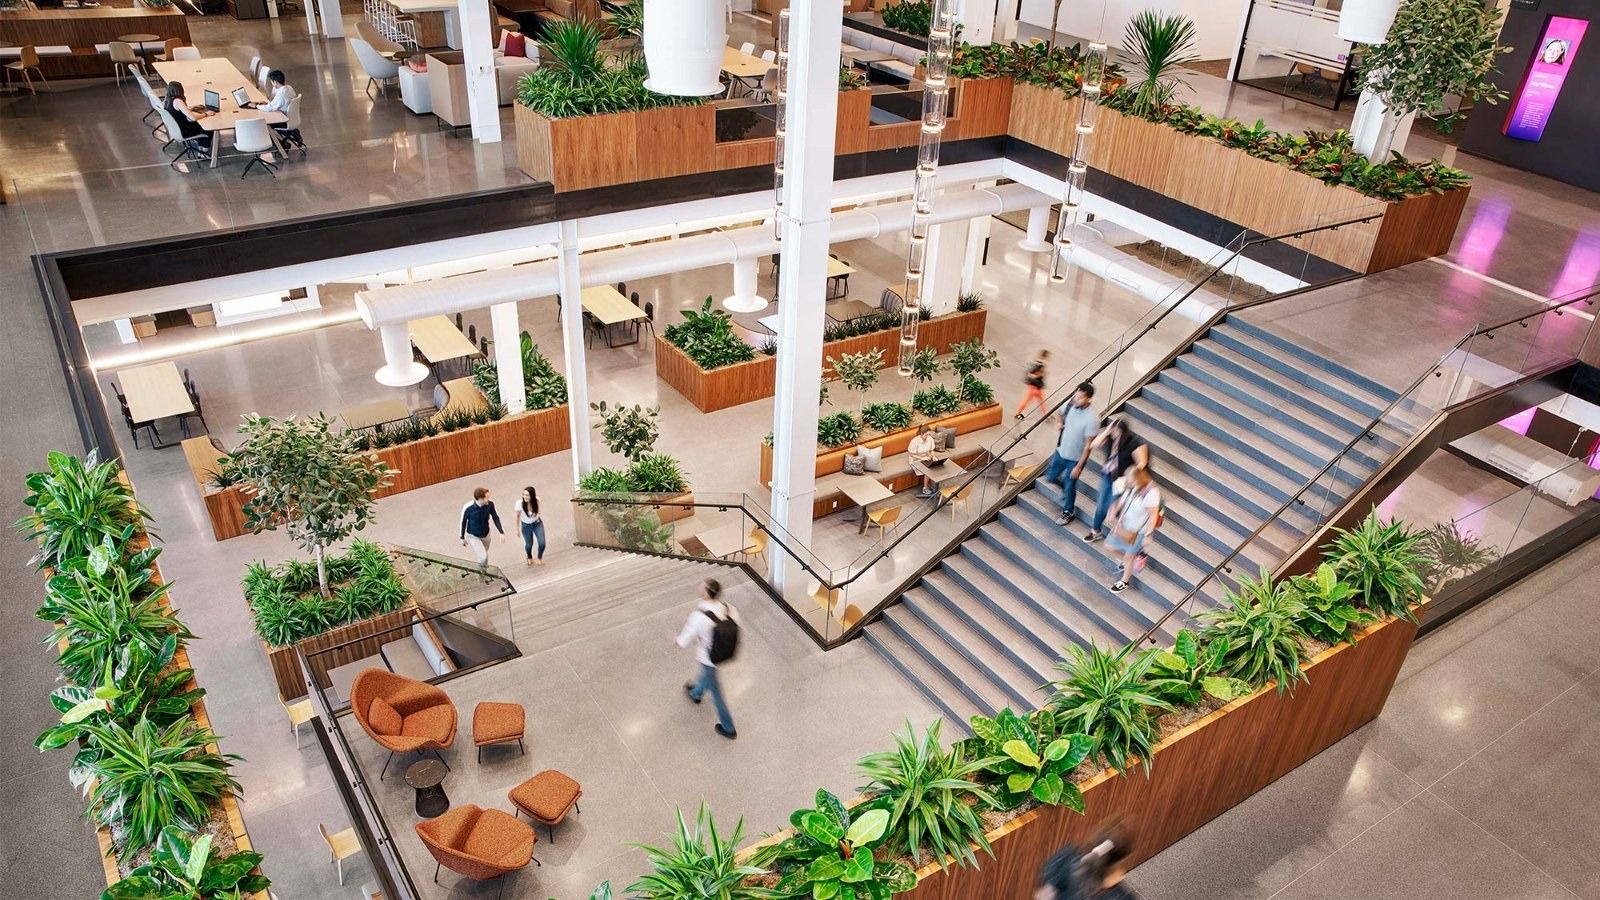 Insight Enterprises $8.3B2025
 - 139
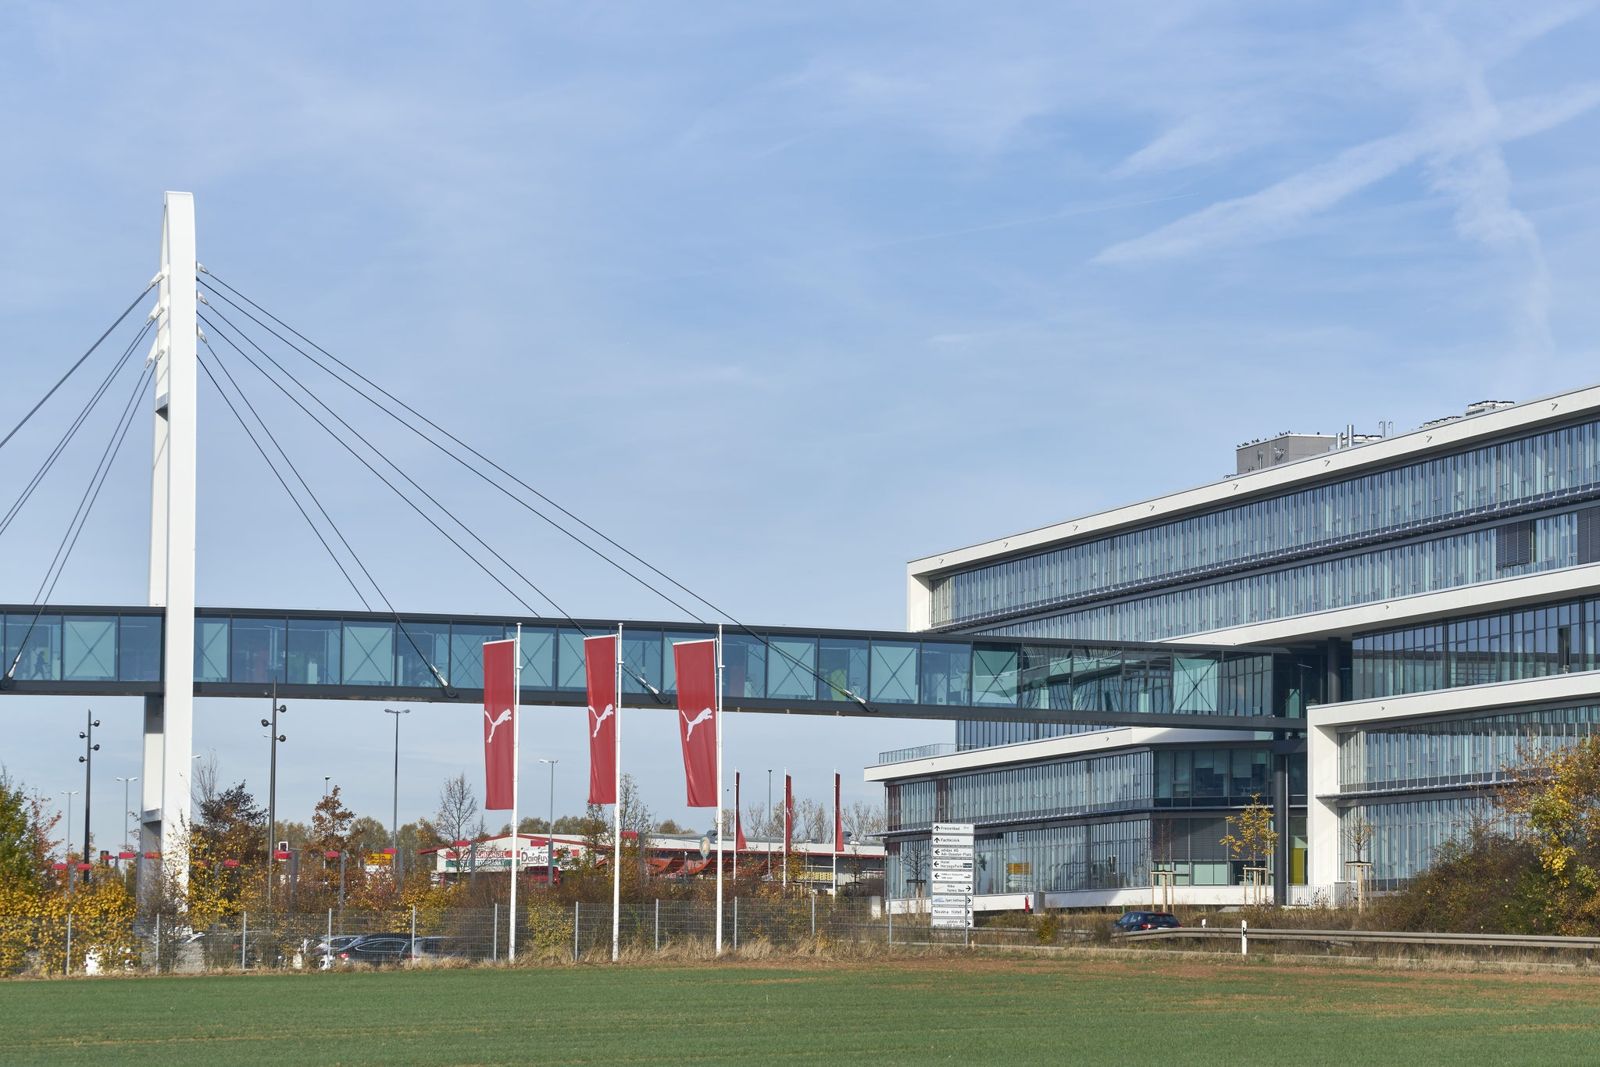 PUMA $8.2B2025
 - 140
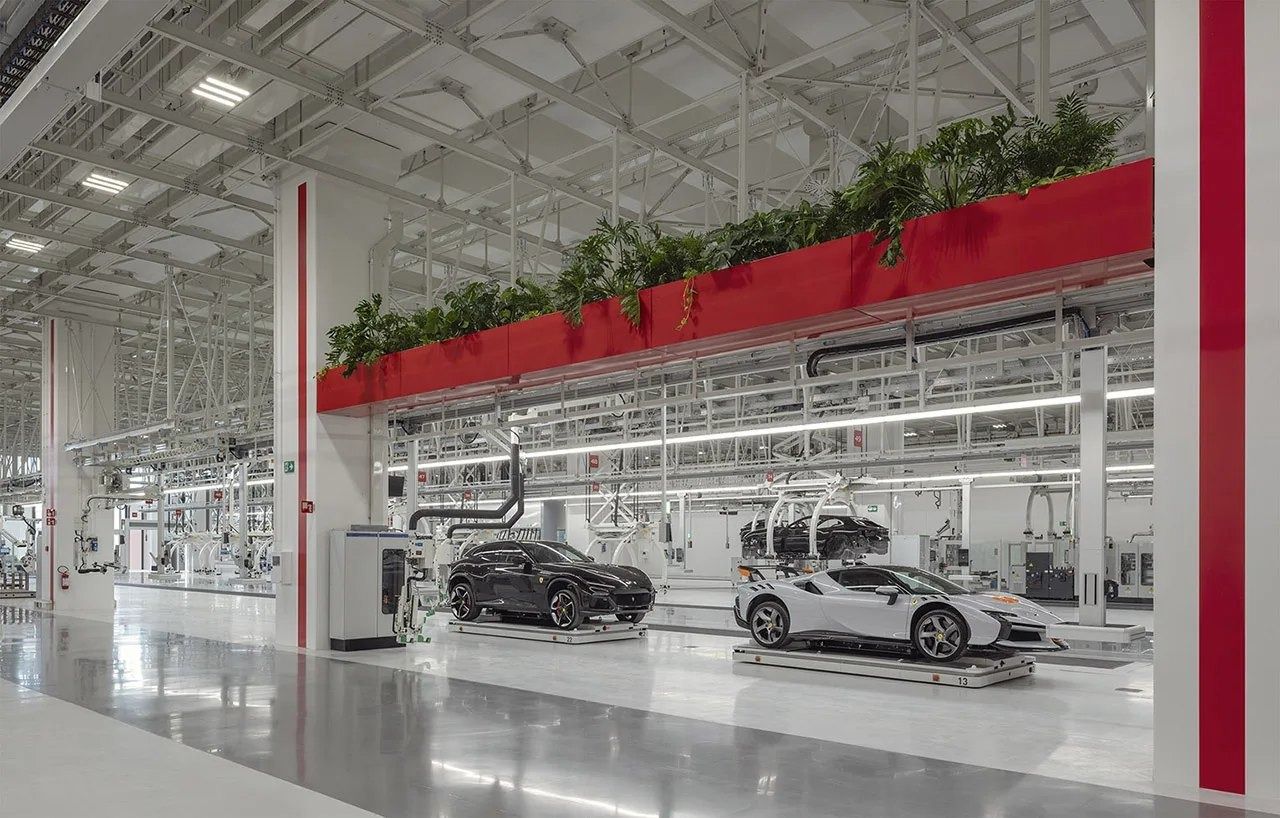 Ferrari ≈$8.1BFY2025
 - 141
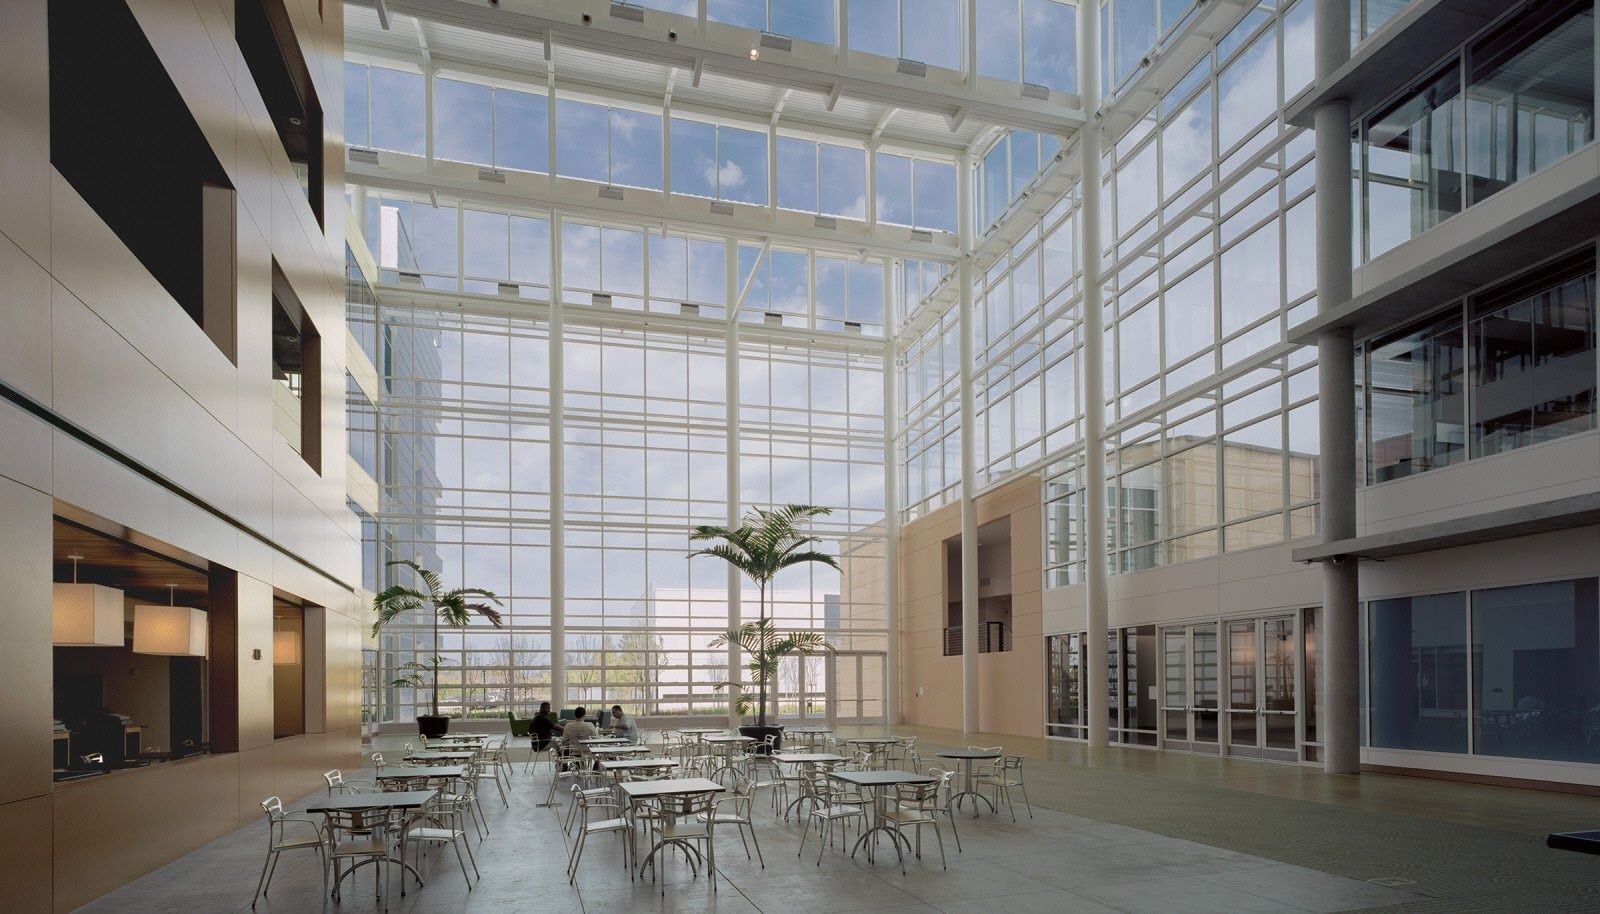 Electronic Arts $7.5BFY2026
 - 142
 Thomson Reuters $7.5B2025
 - 143
 T. Rowe Price $7.3B2025
 - 144
 Autodesk $7.2BFY2026
 - 145
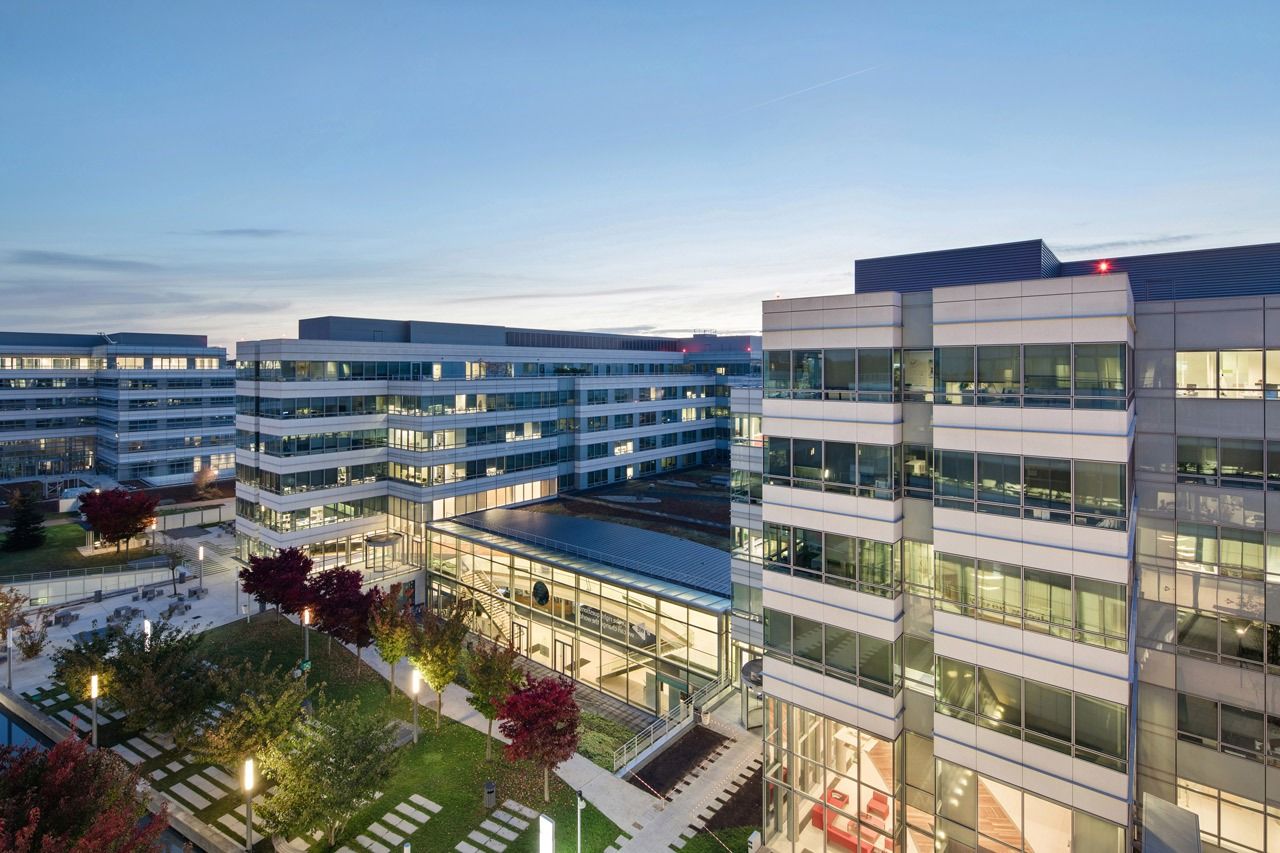 Dassault Systèmes ≈$7.0BFY2025
 - 146
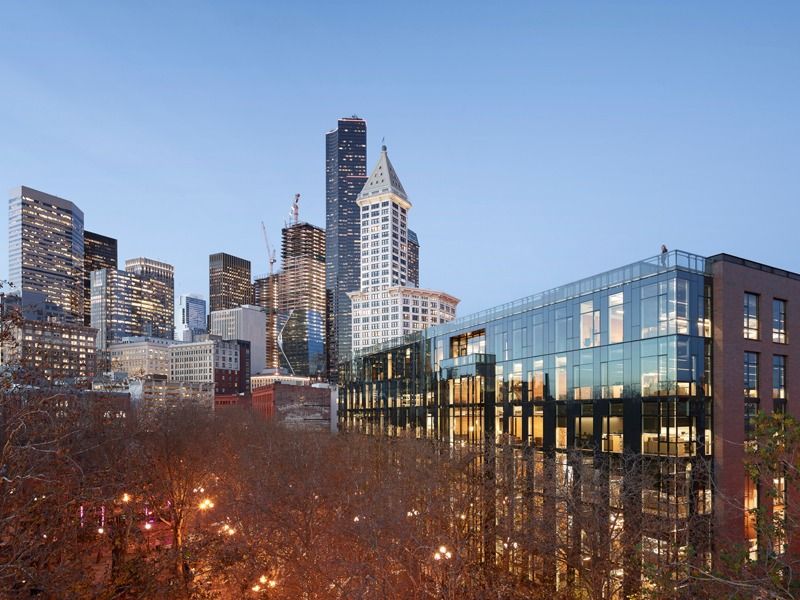 Weyerhaeuser $6.9B2025
 - 147
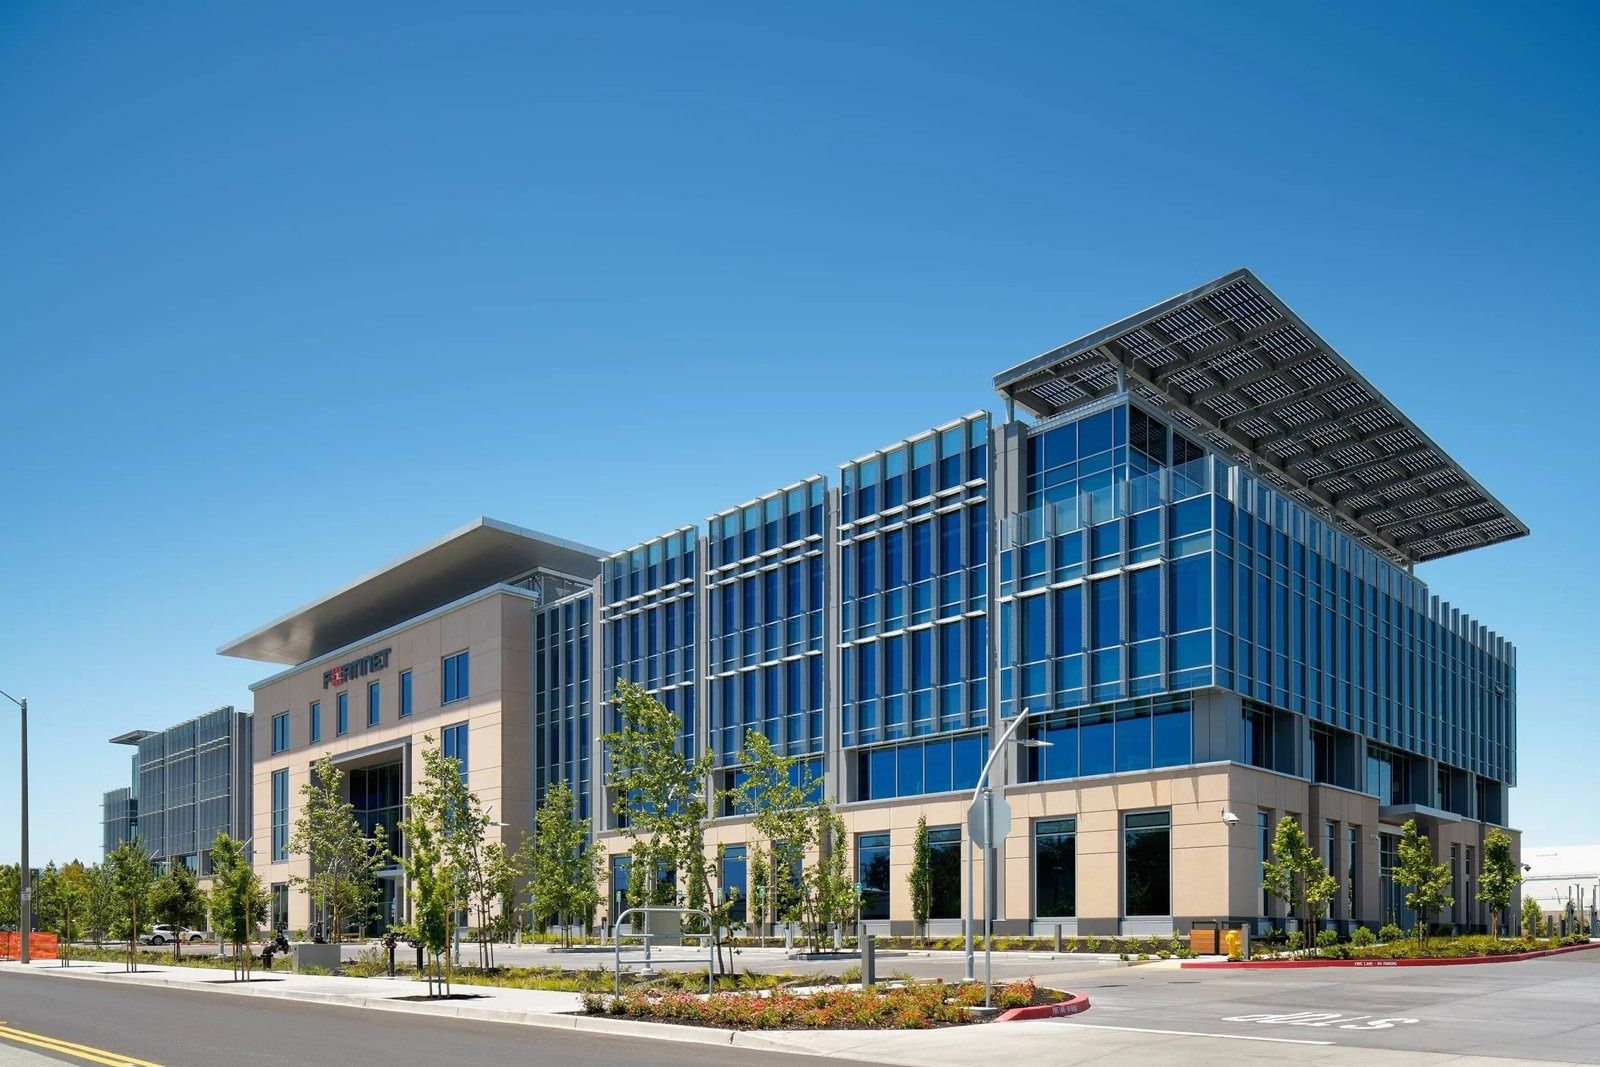 Fortinet $6.8BFY2025
 - 147
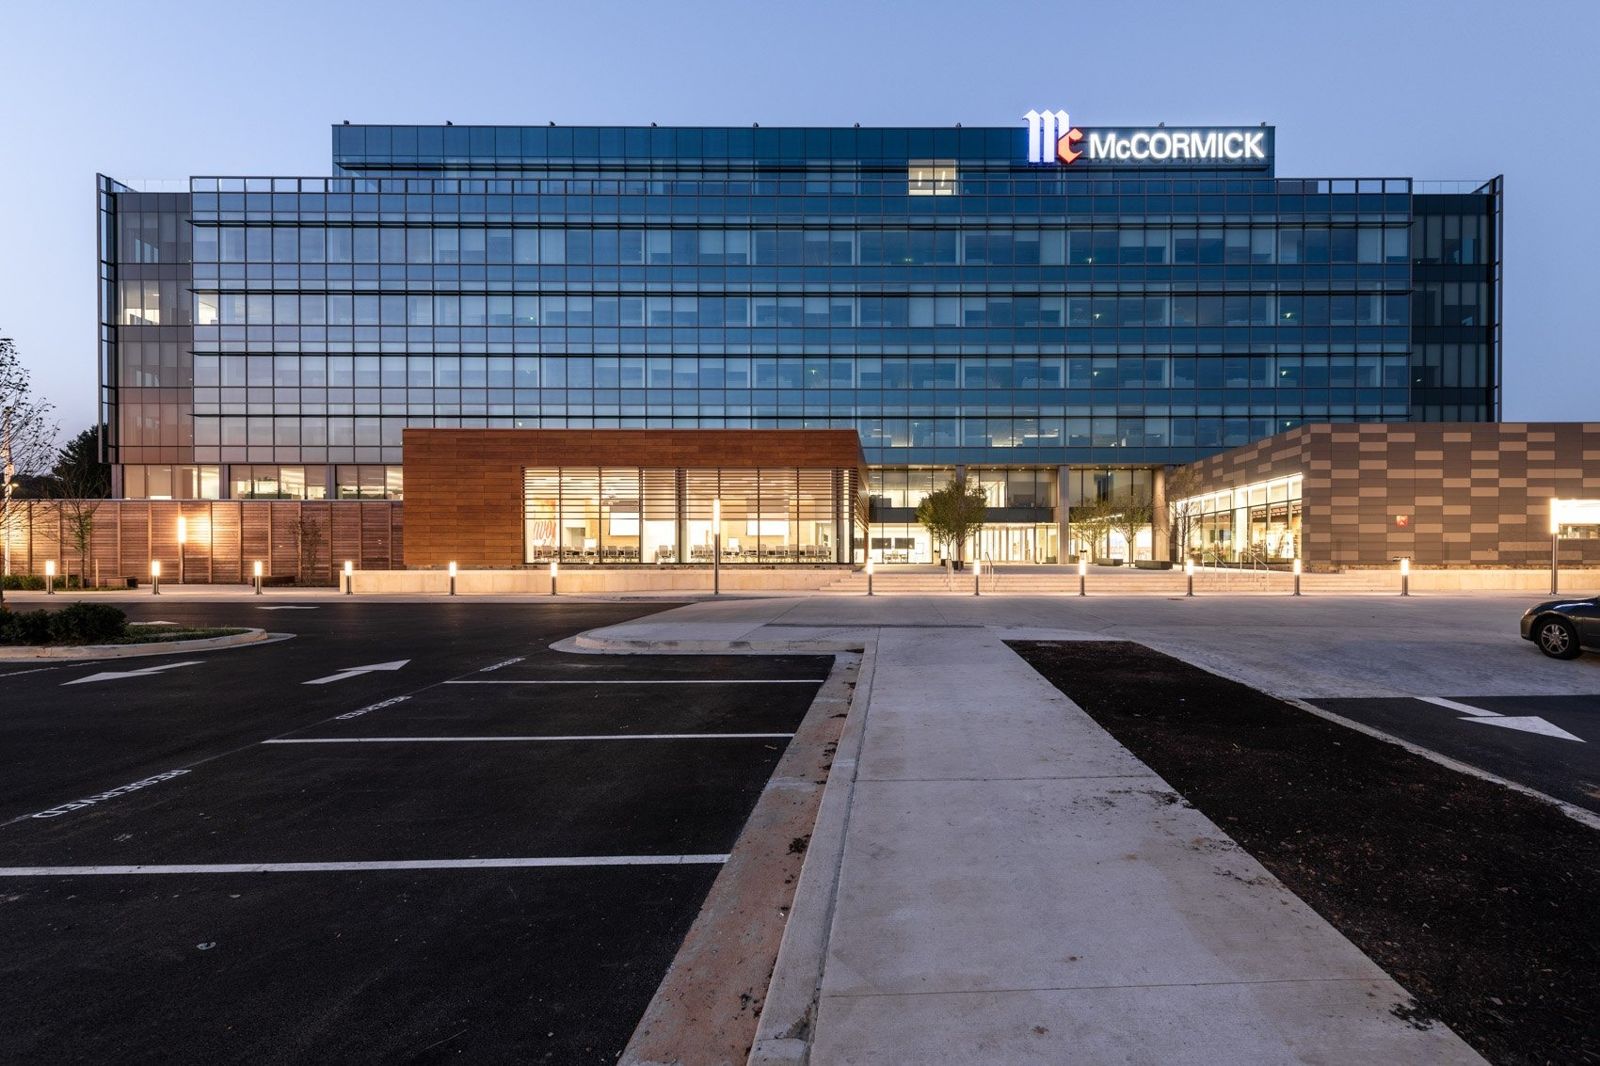 McCormick $6.8B2025
 - 149
 Take-Two Interactive $6.7BFY2026
 - 150
 Atlassian $6.6BFY2026
 - 151
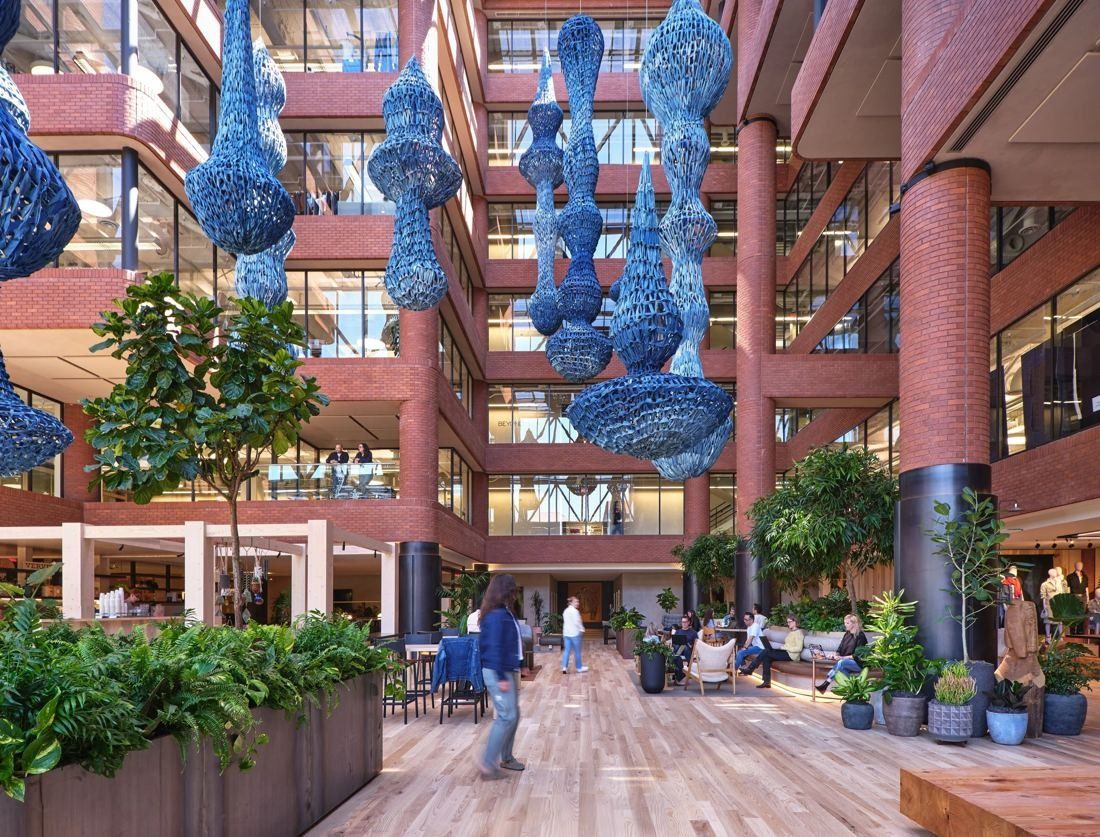 Levi Strauss & Co. $6.3BFY2025
 - 151
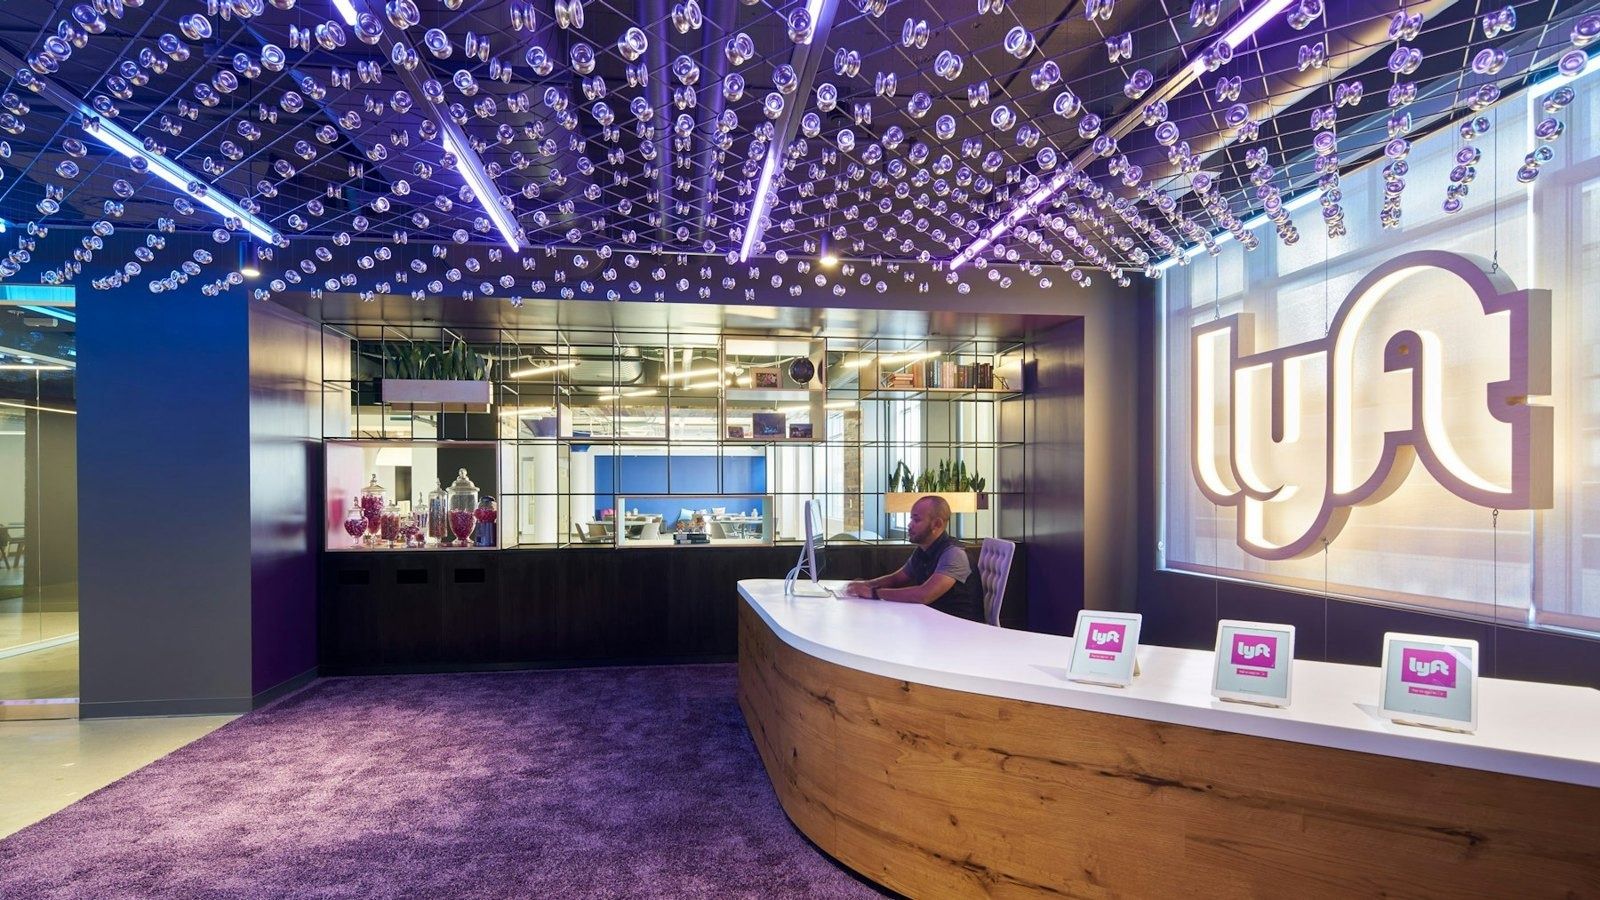 Lyft $6.3B2025
 - 153
 Edwards Lifesciences $6.1B2025
 - 154
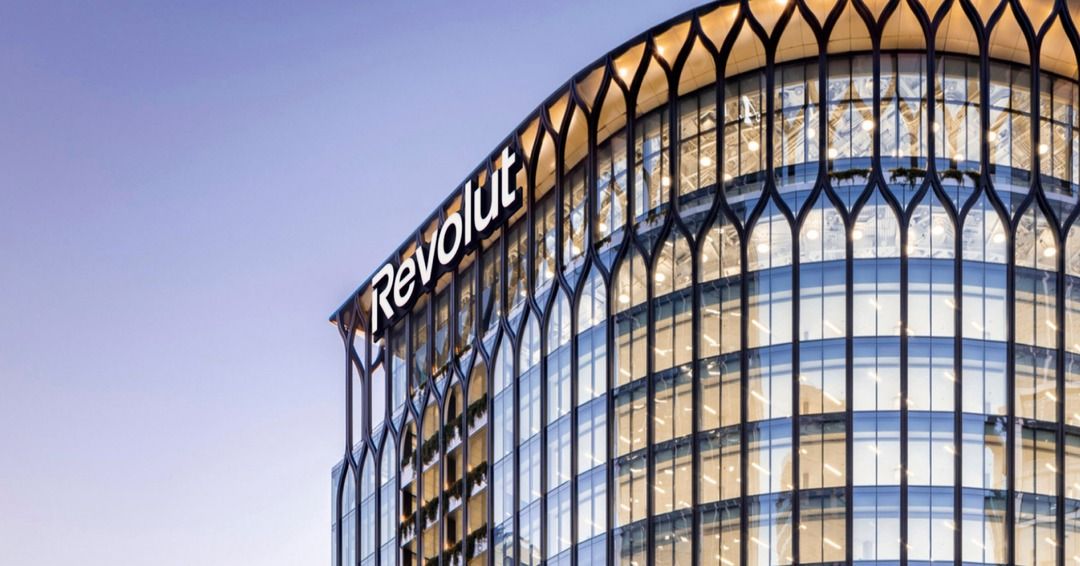 Revolut $6.0B2025
 - 155
 Snap $5.9B2025
 - 156
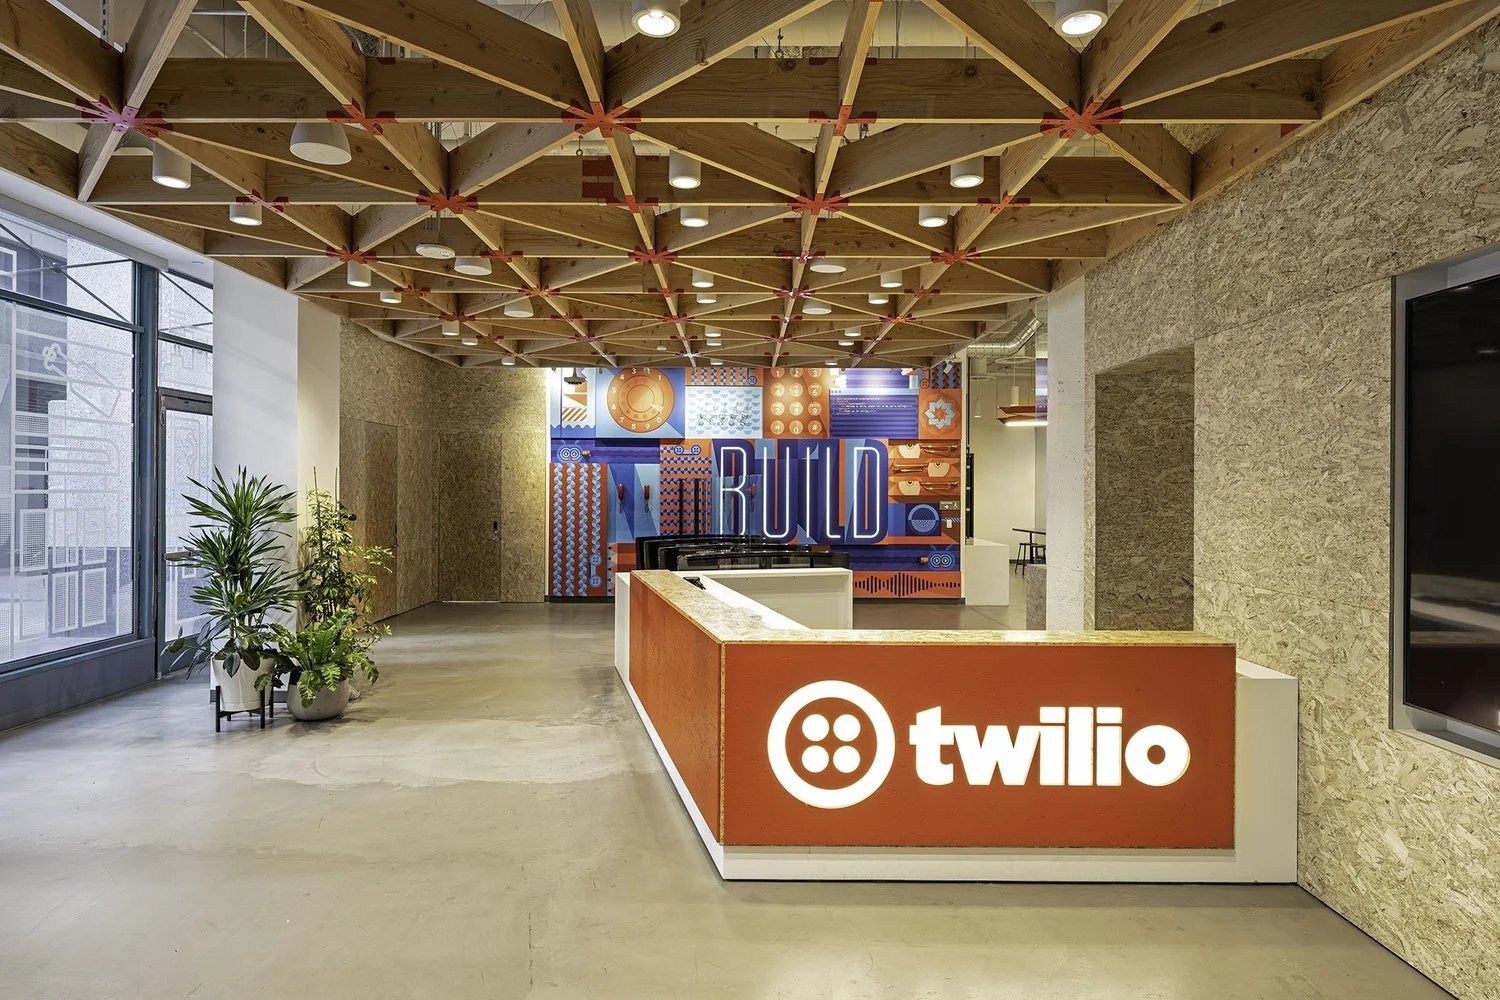 Twilio $5.1B2025
 - 157
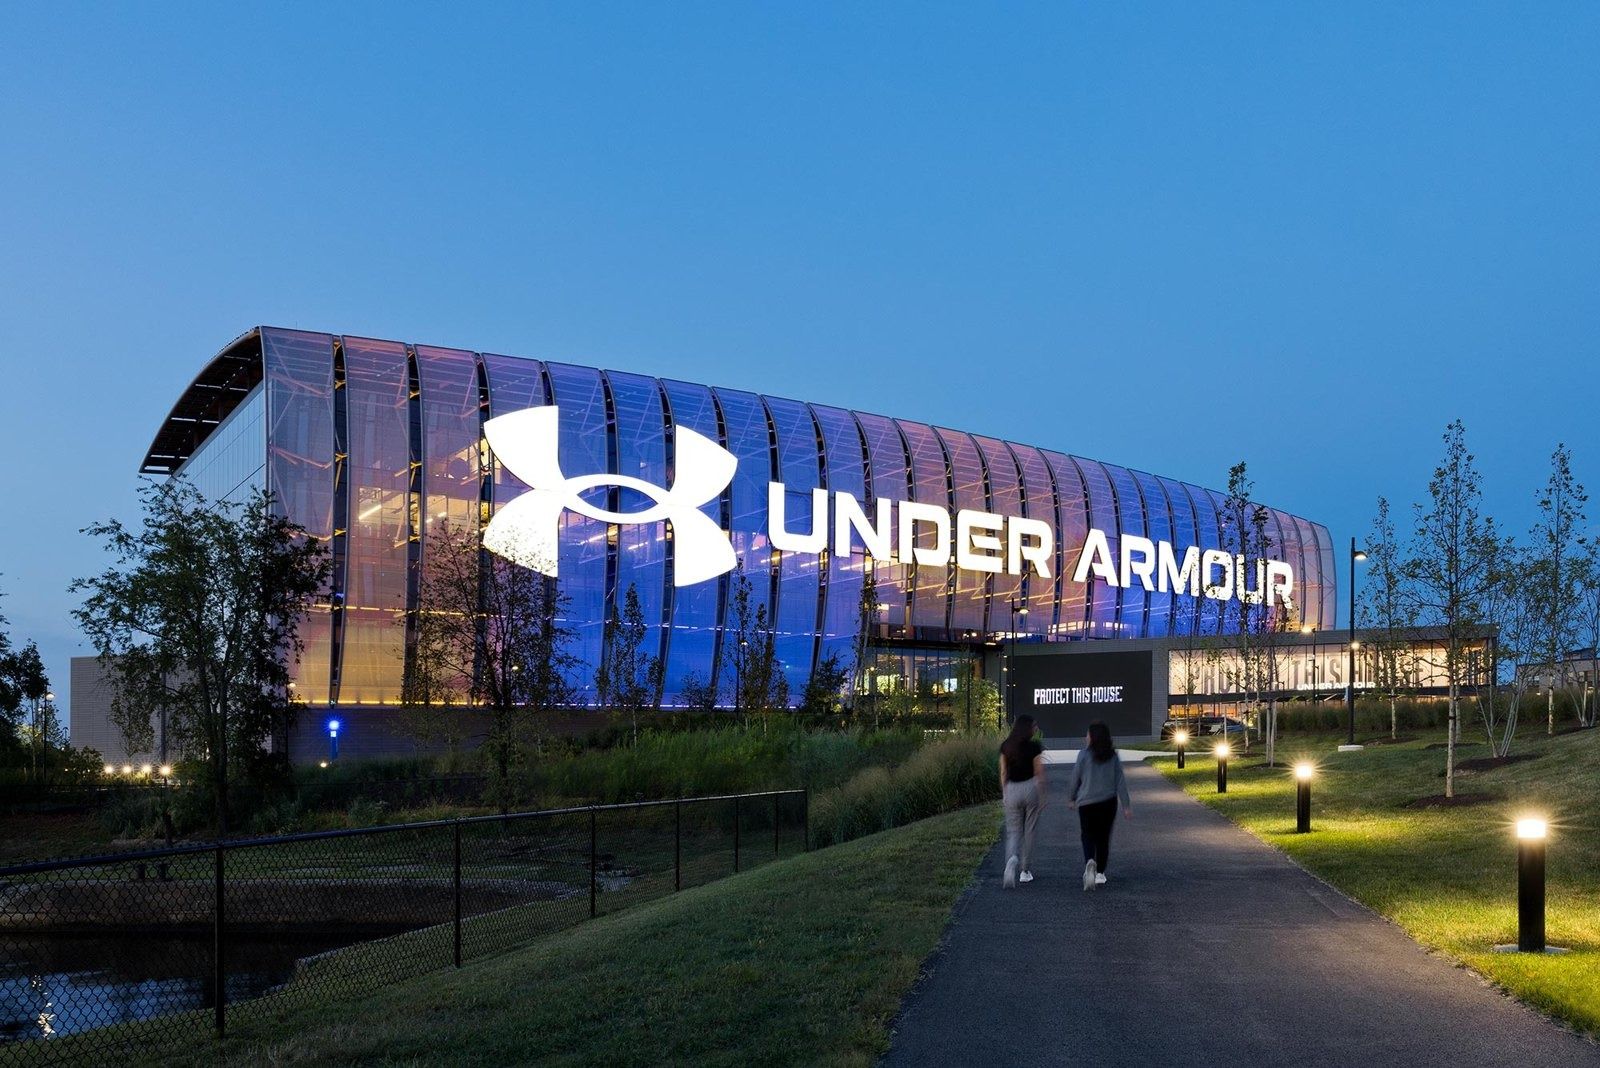 Under Armour $5.0BFY2026
 - 158
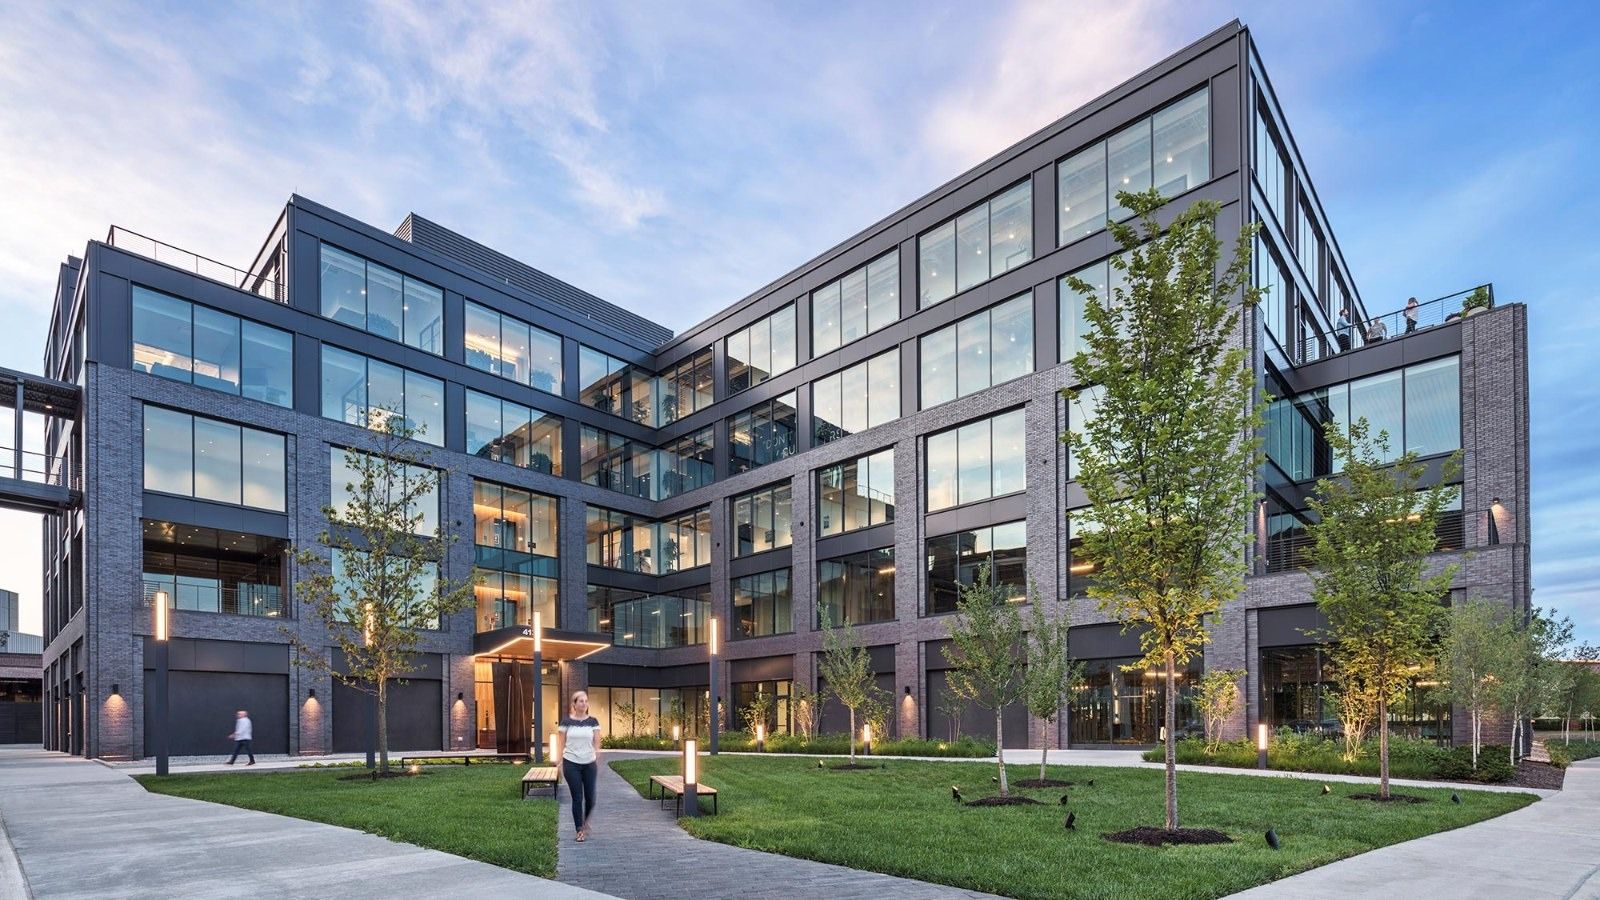 M/I Homes $4.4B2025
 - 159
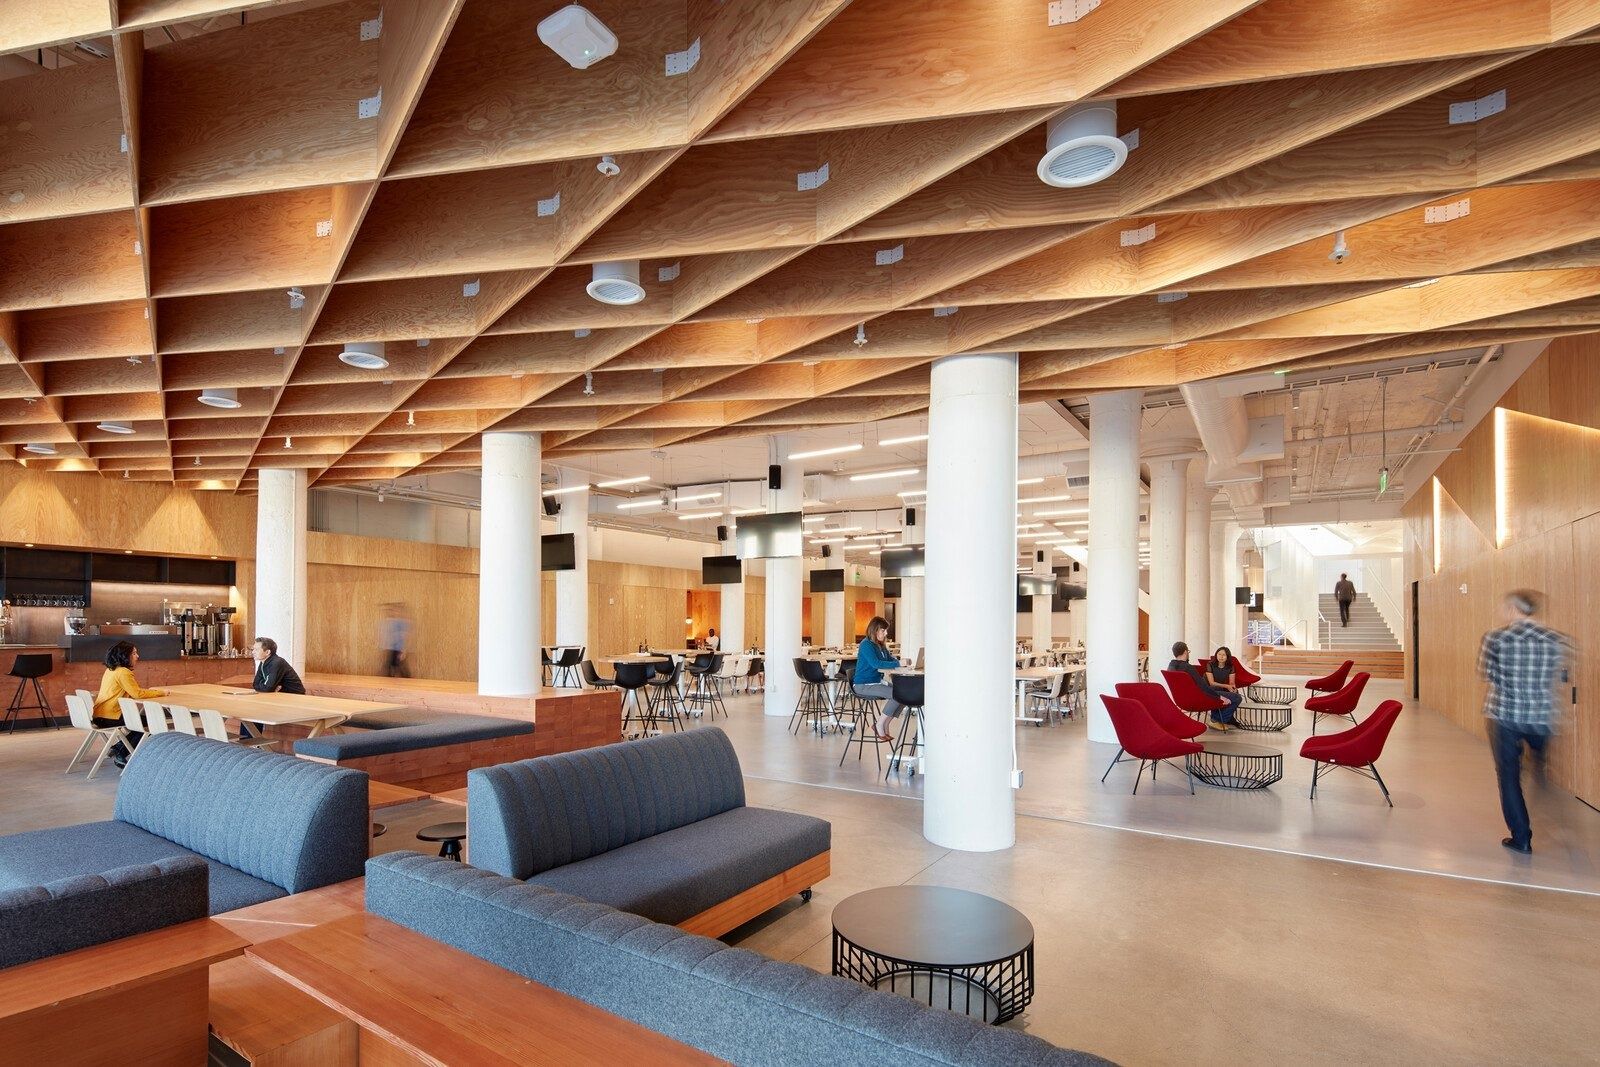 Pinterest $4.2B2025
 - 160
 Akamai $4.2B2025
 - 161
 Western Union $4.0B2025
 - 162
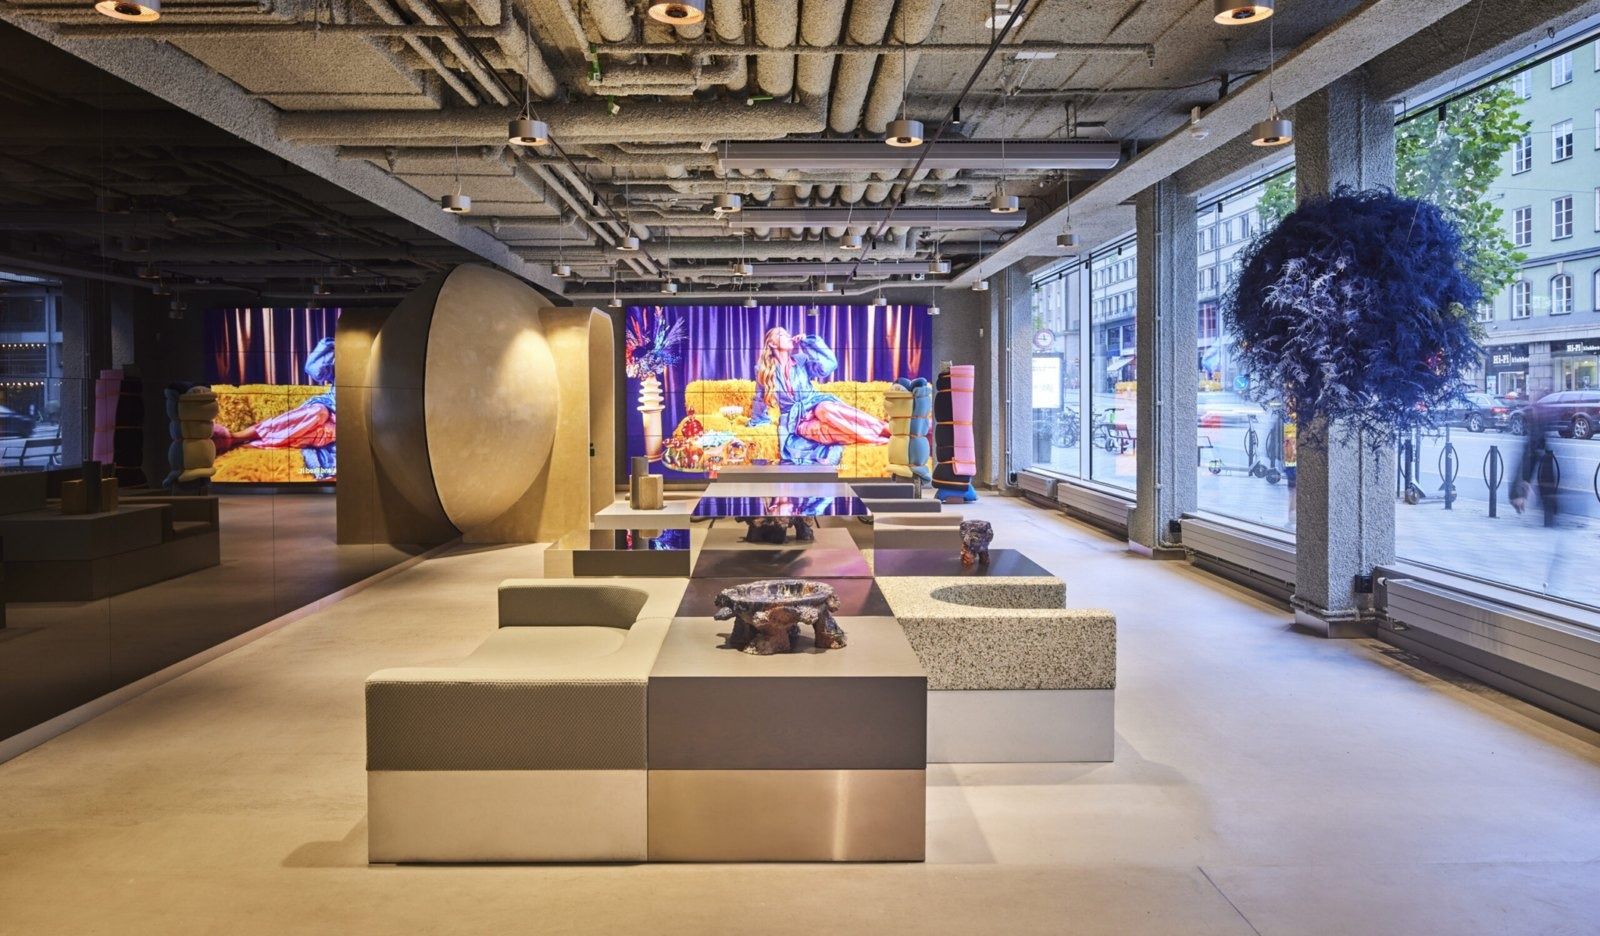 Klarna $3.5B2025
 - 163
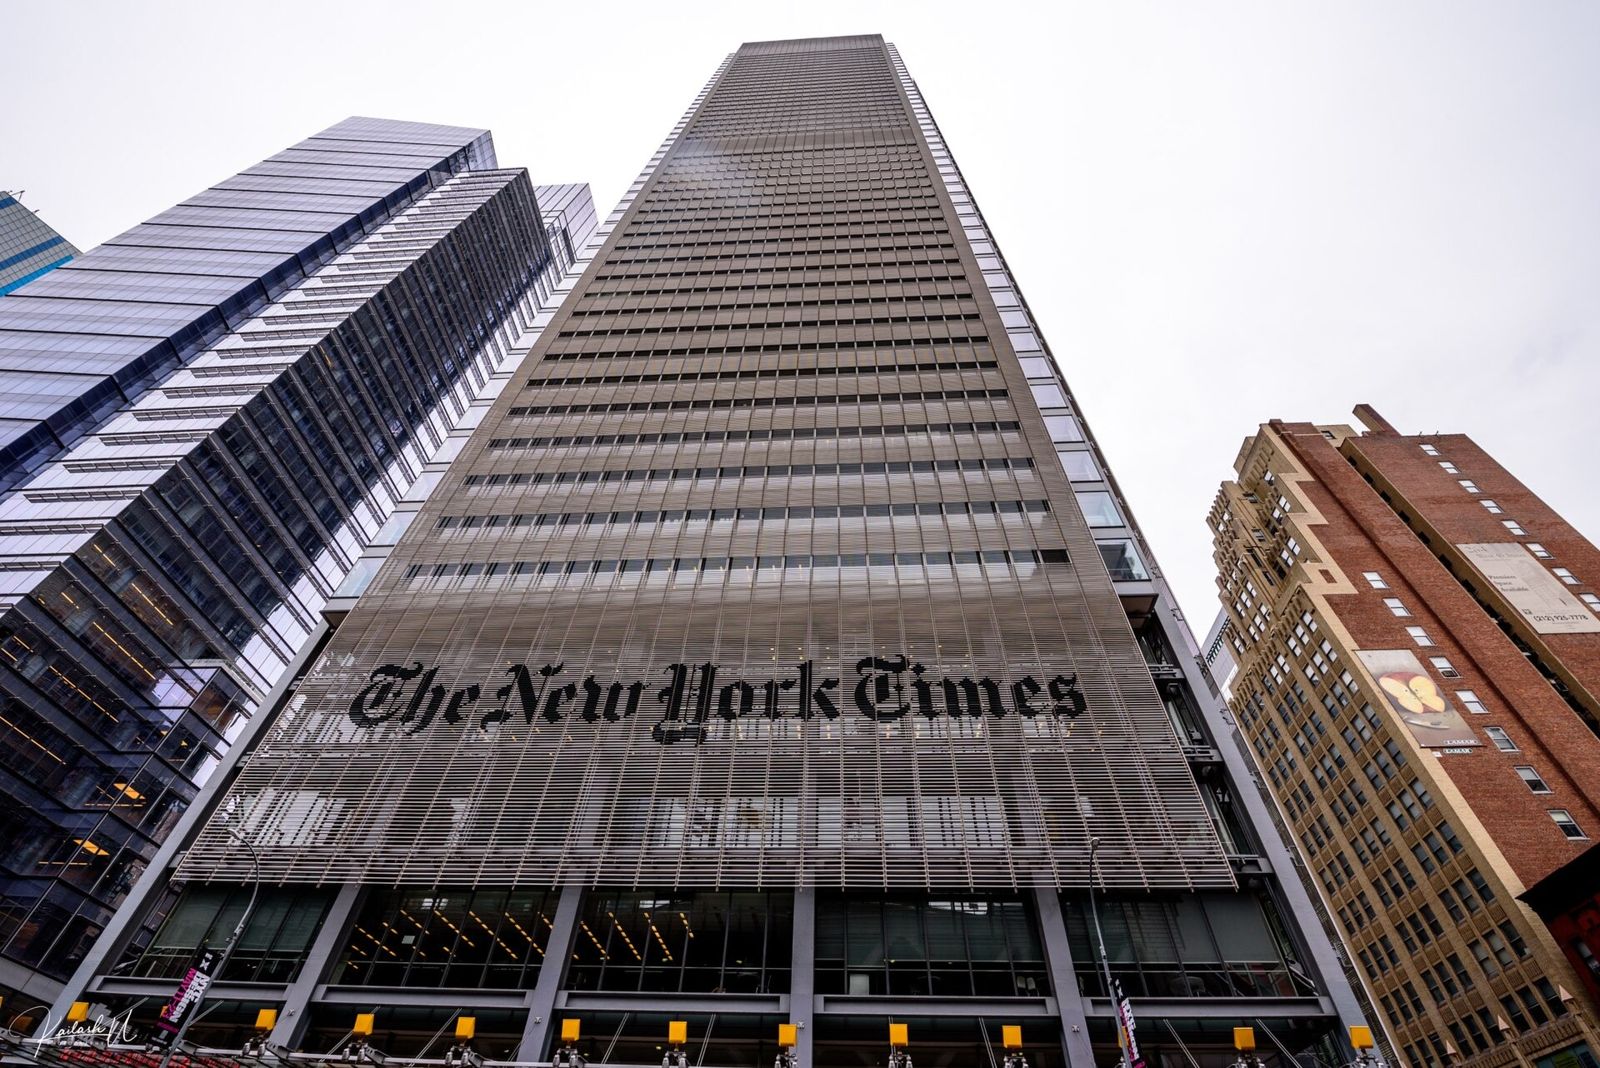 Datadog $3.4B2025
 - 164
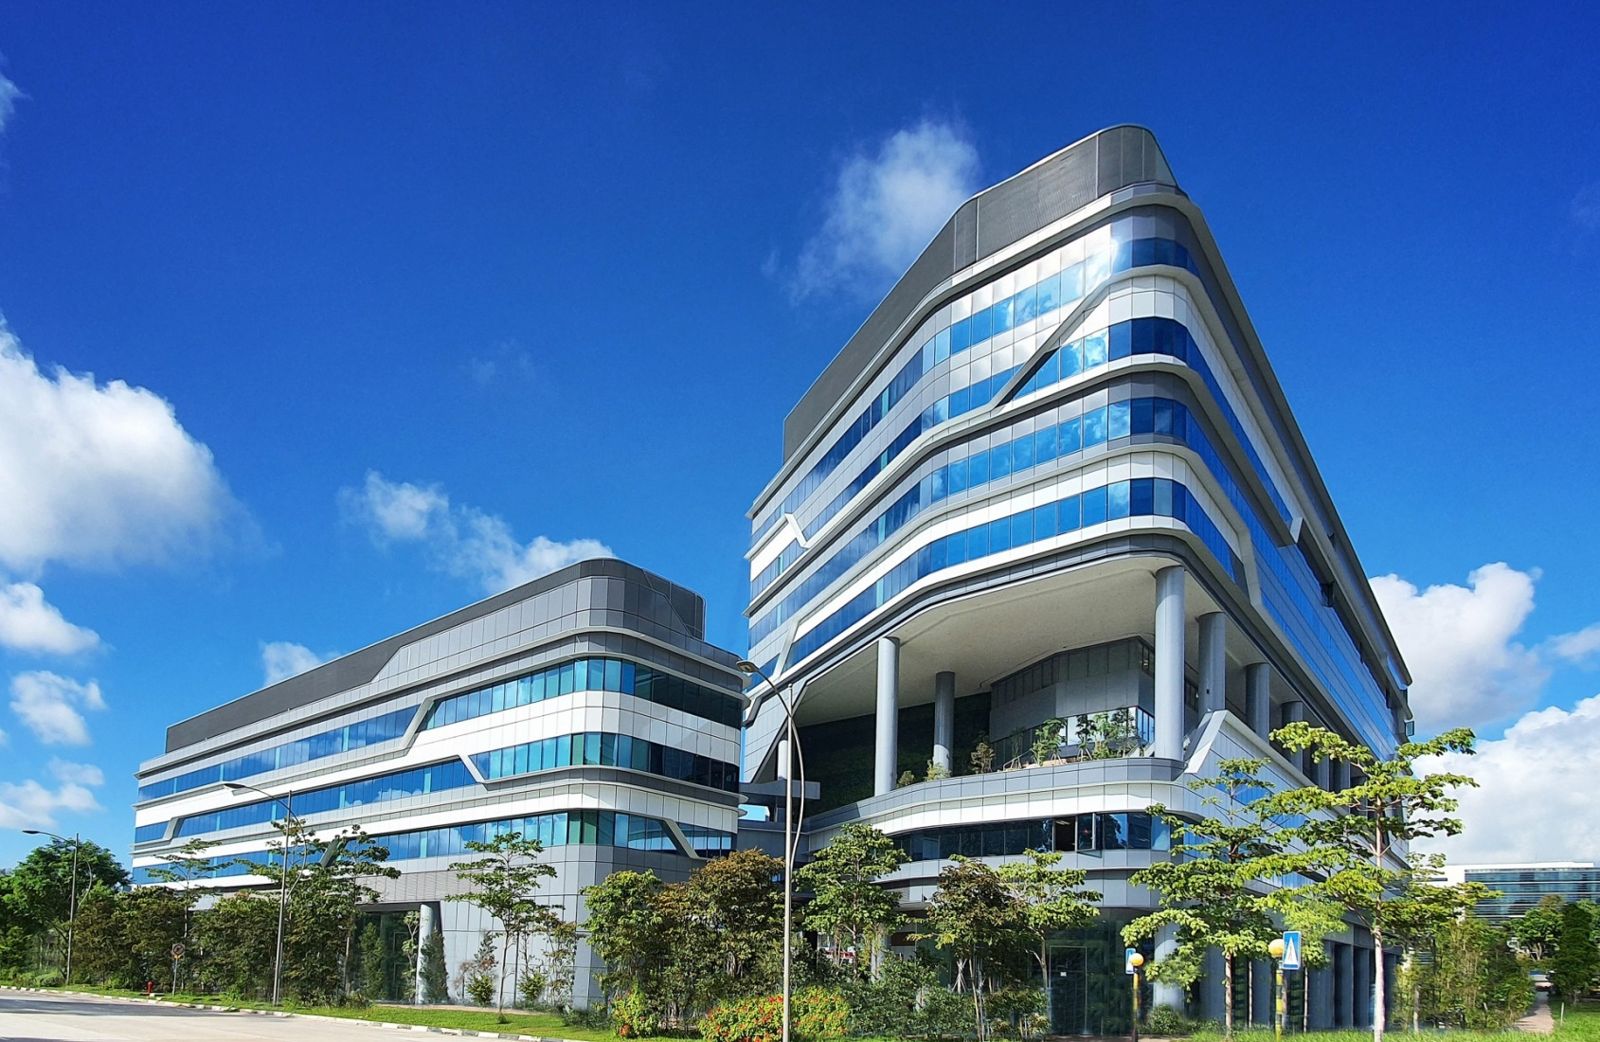 Grab $3.4B2025
 - 165
 HubSpot $3.1B2025
 - 166
 AvalonBay Communities $3.0B2025
 - 167
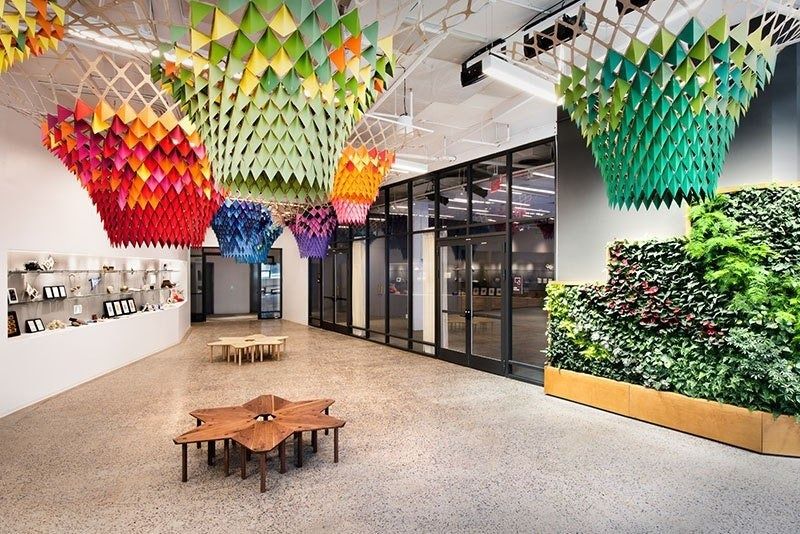 Etsy $2.9B2025
 - 168
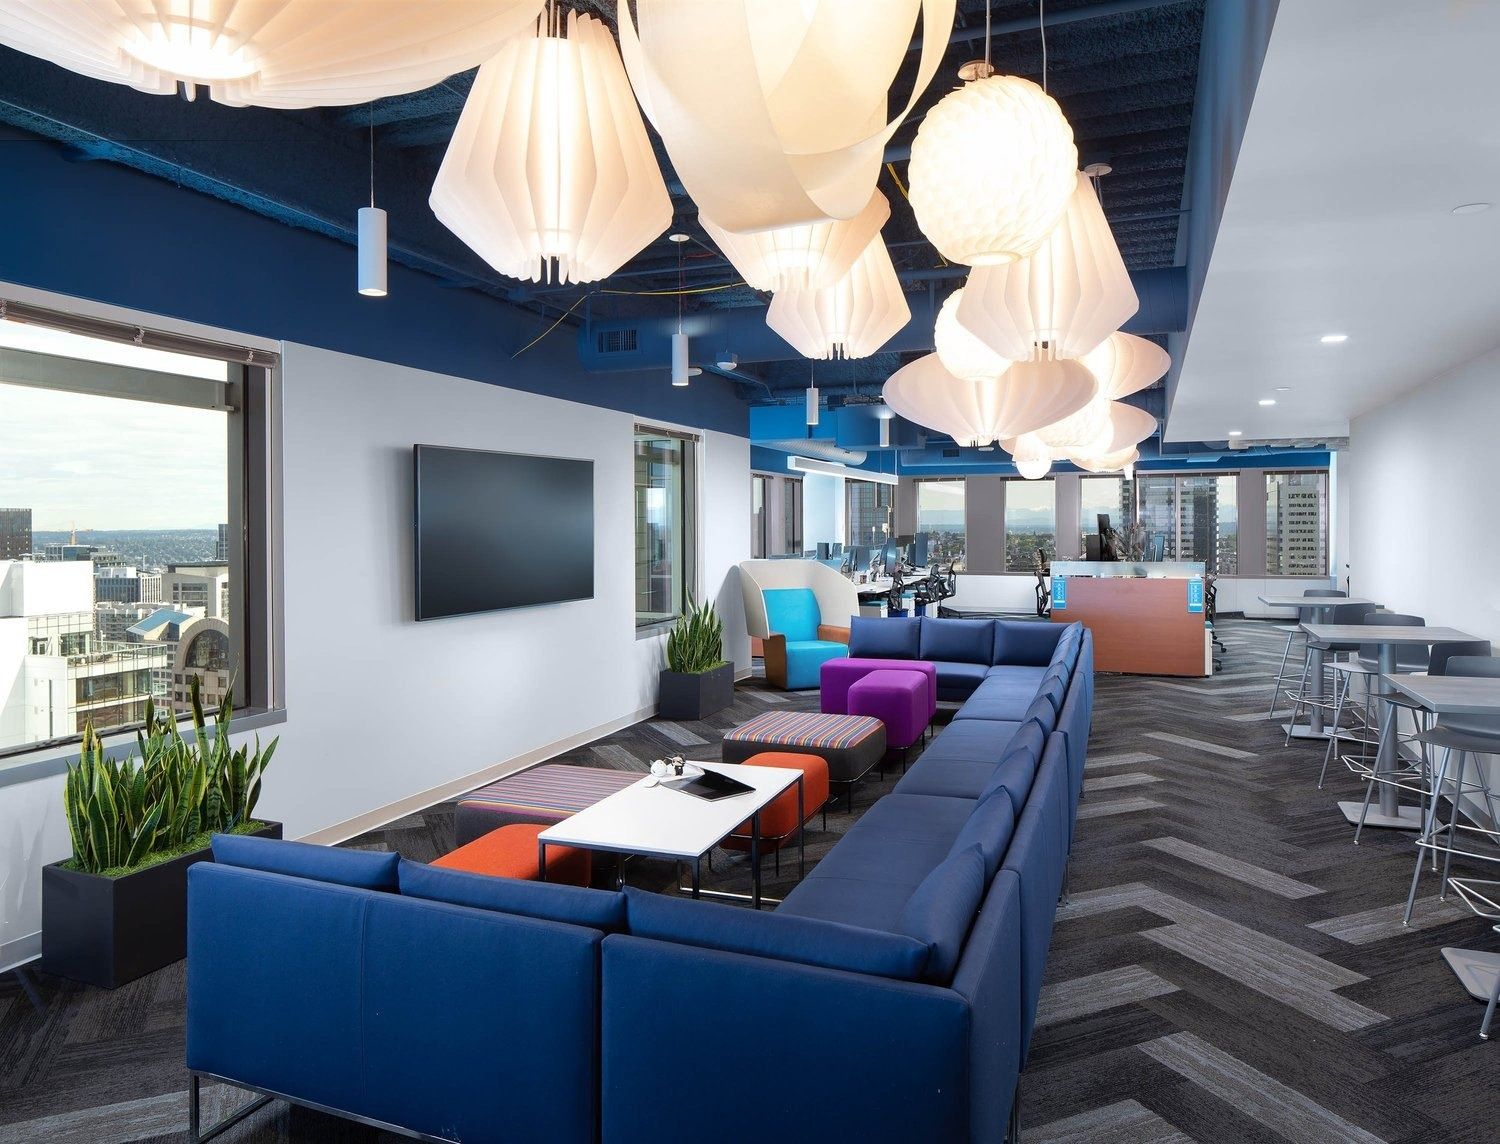 Zillow $2.6B2025
 - 169
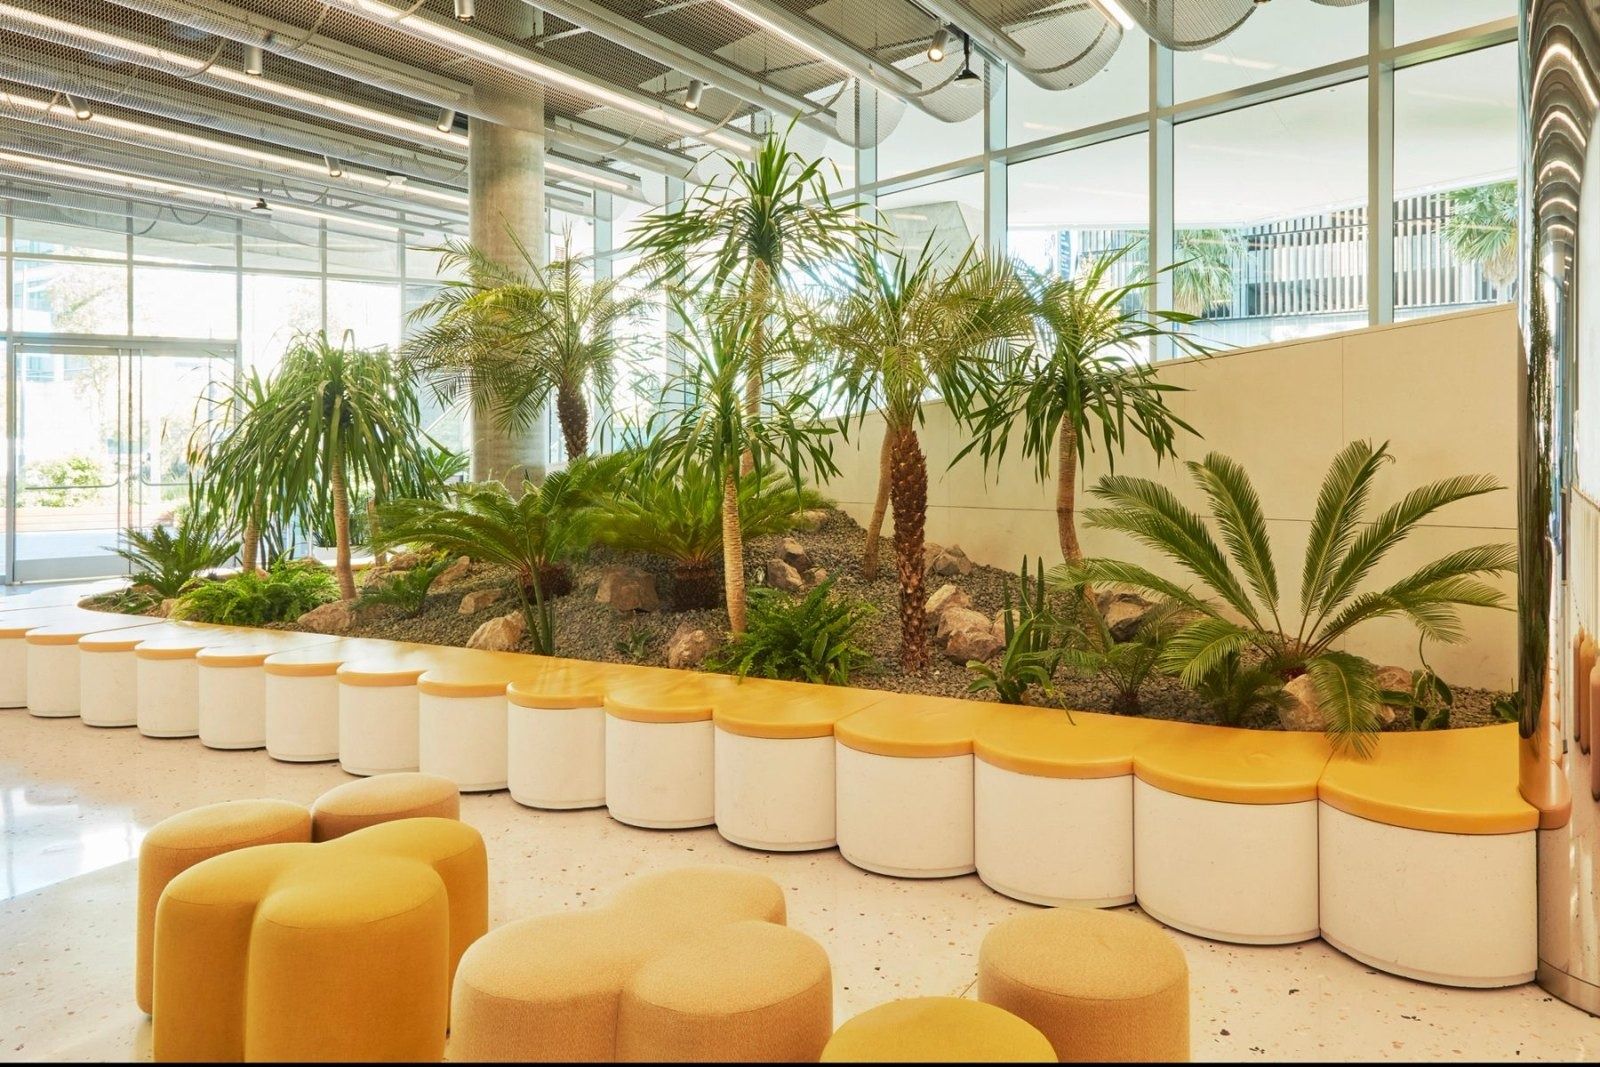 Dropbox $2.5B2025
 - 170
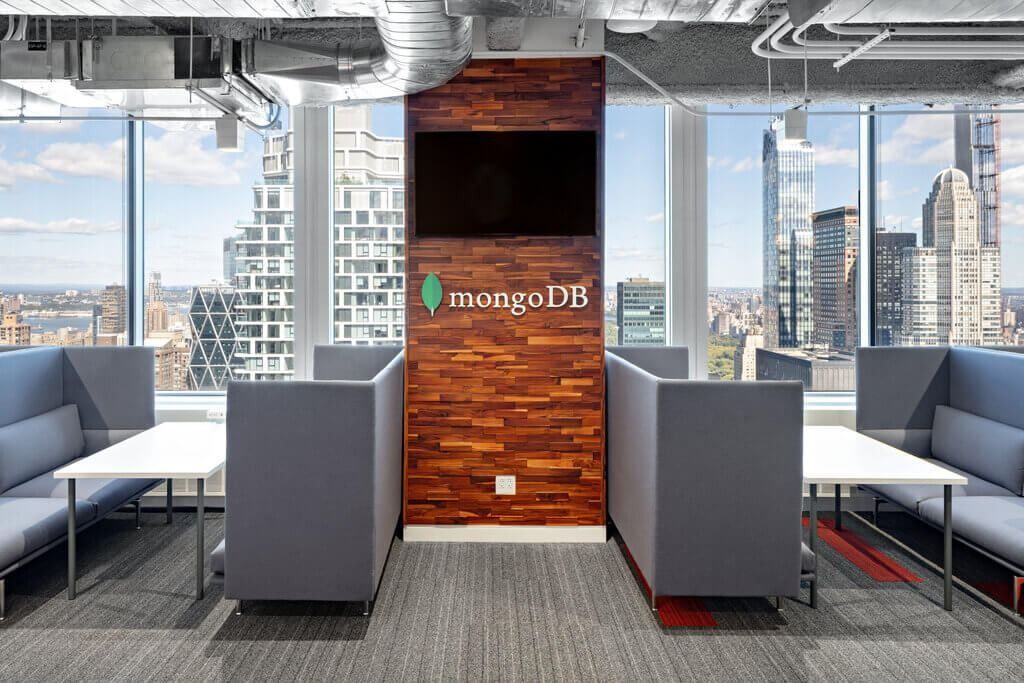 MongoDB $2.5BFY2026
 - 171
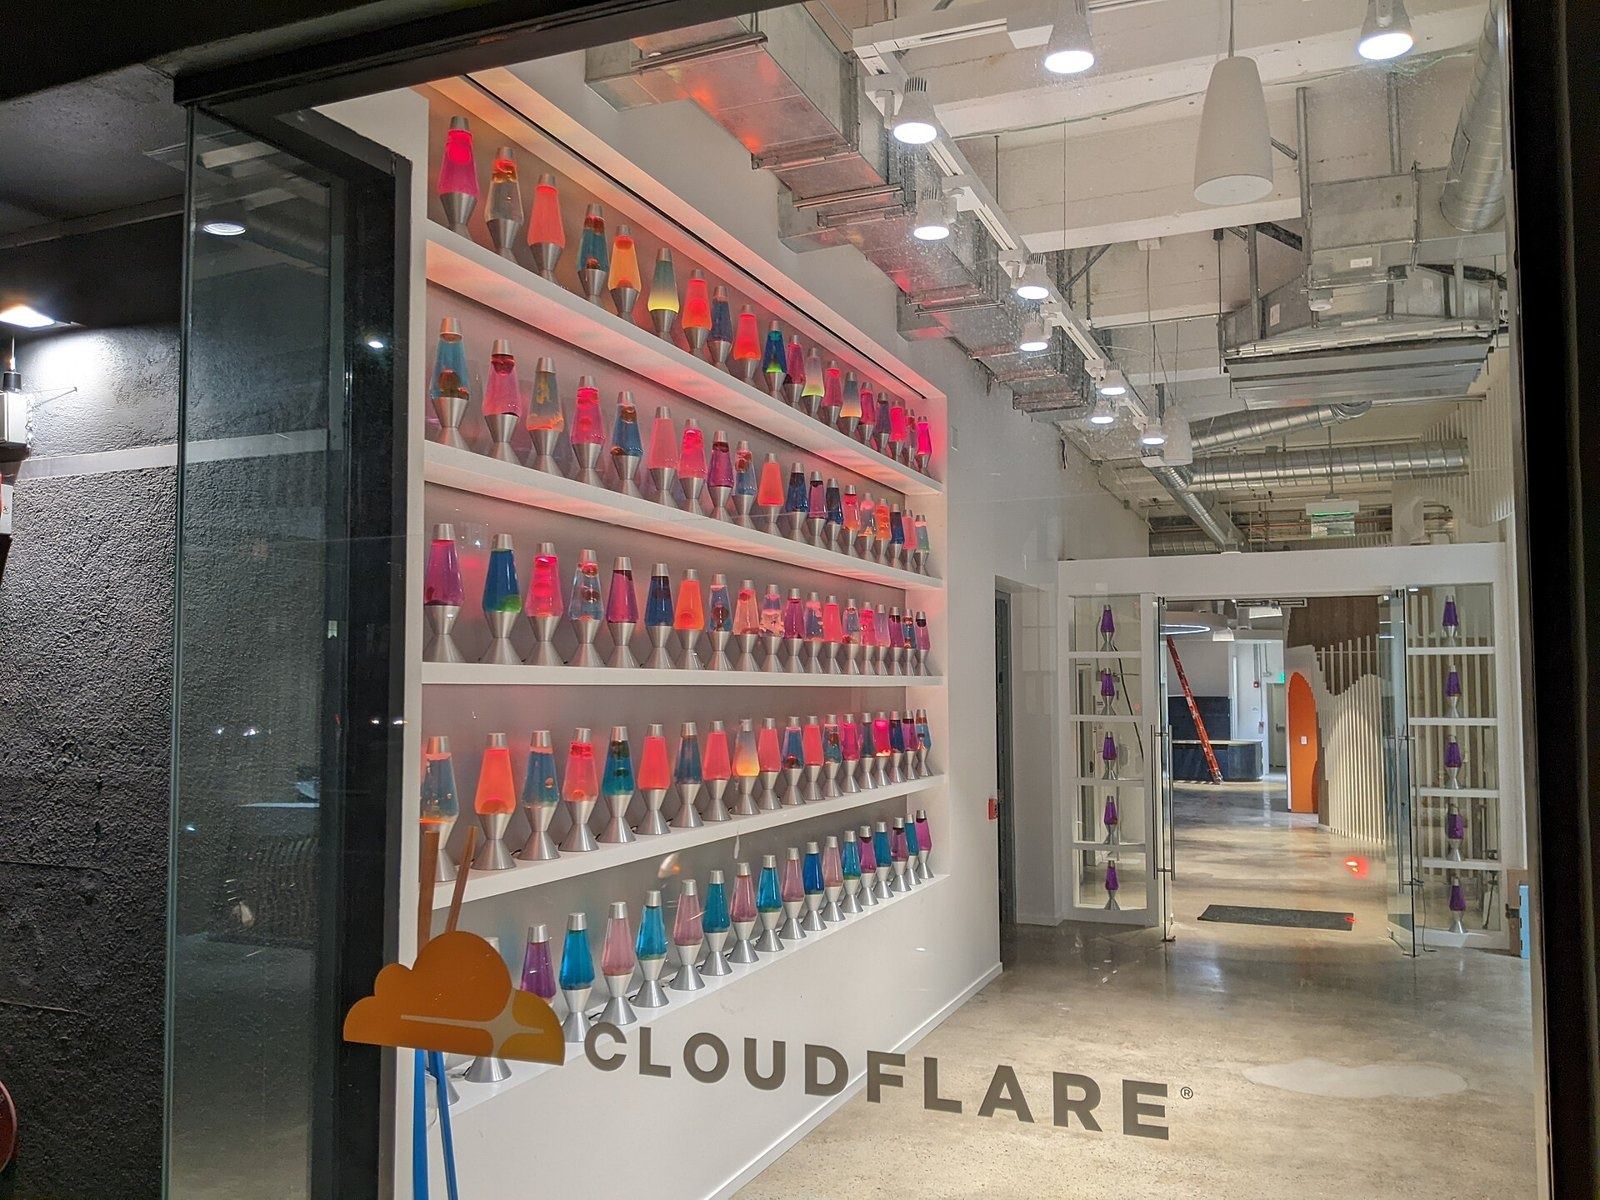 Cloudflare $2.2B2025
 - 172
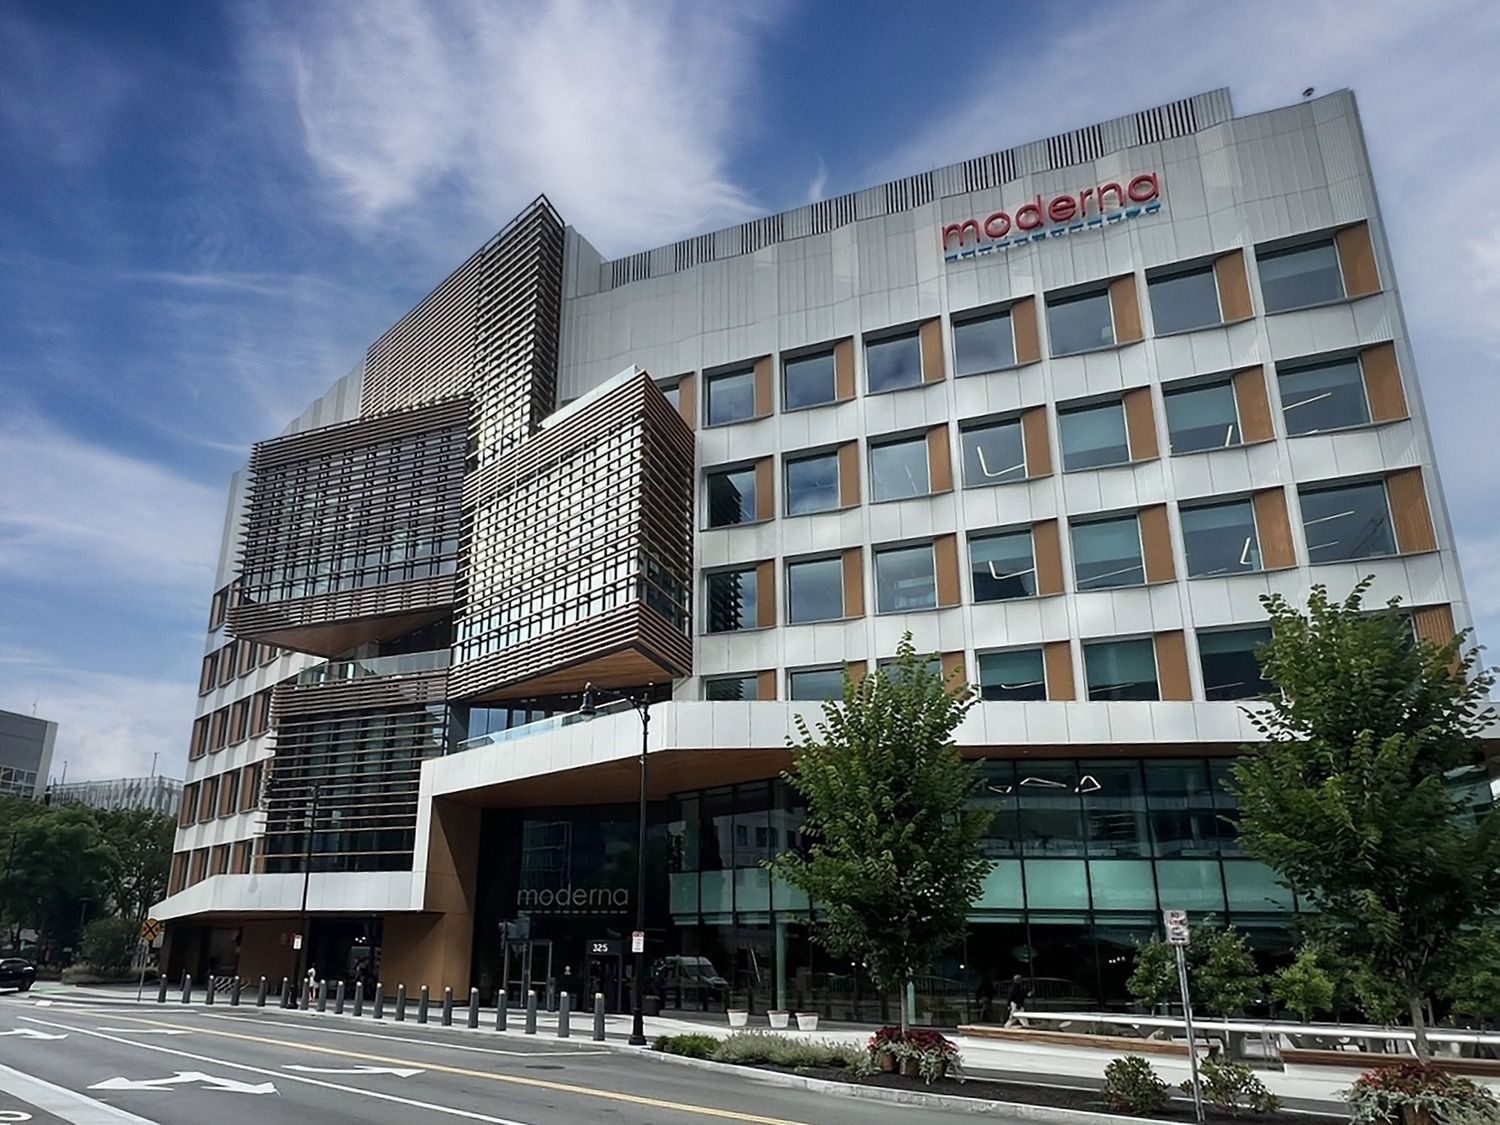 Moderna $1.9B2025
 - 173
 MathWorks $1.5B2025
 - 174
 Walker & Dunlop $1.2B2025
 - 175
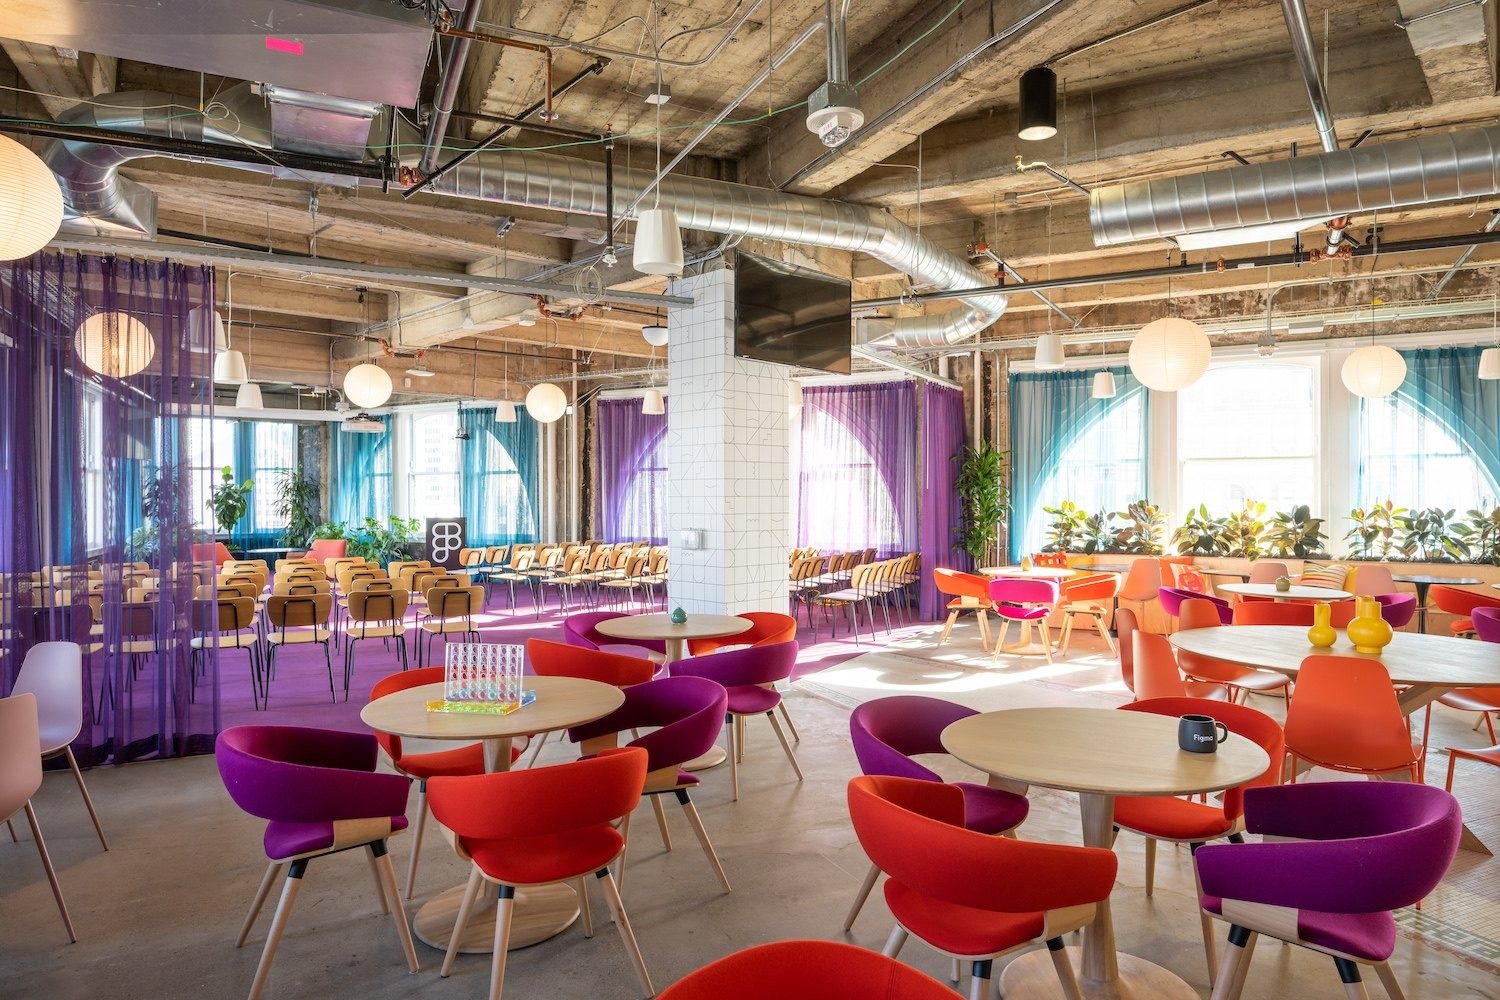 Figma $1.1B2025
 - 176
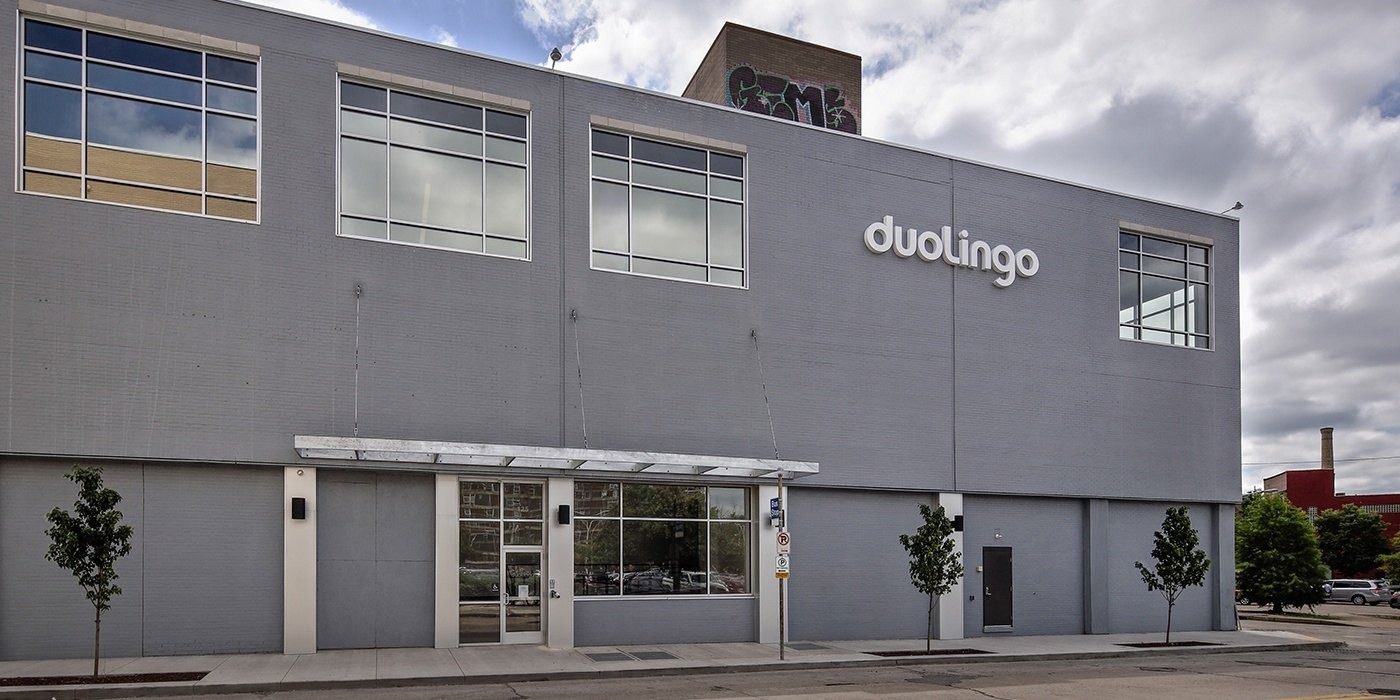 Duolingo $1.0B2025
 - 177
 Squarespace $1.0B2023
 - 178
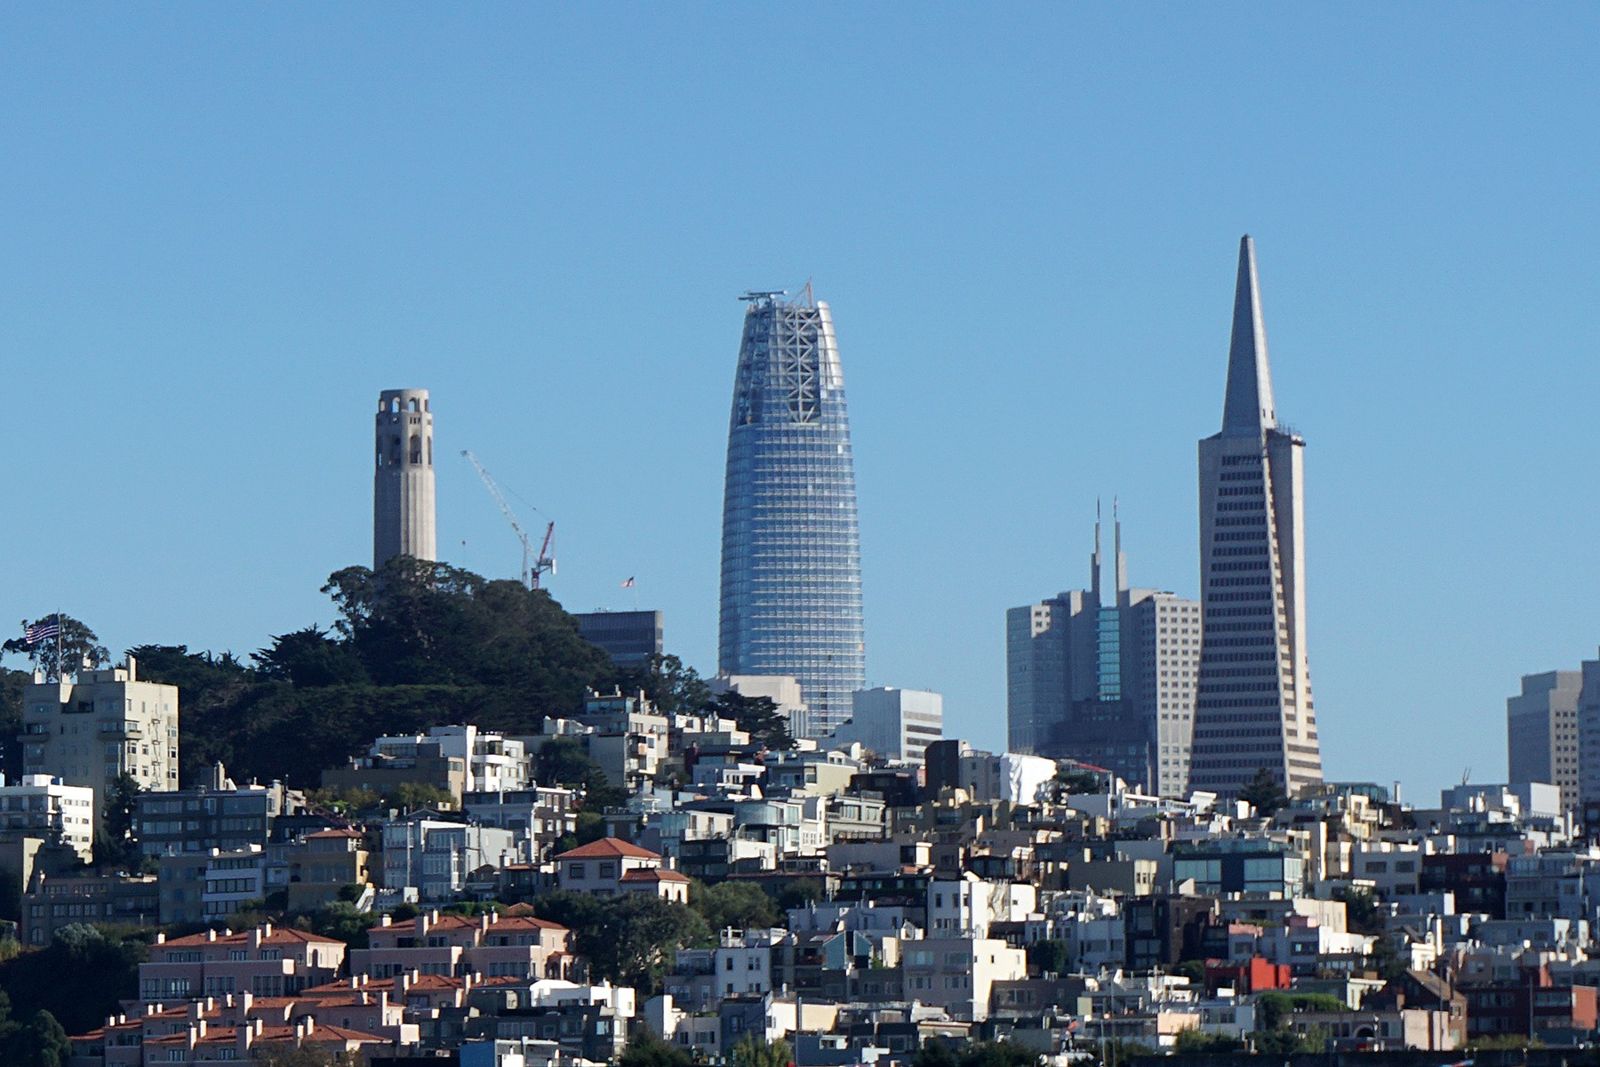 Slack $0.9BFY2021
 - 179
 Silicon Labs $0.8B2025
 - 180
 Bandwidth $0.8B2025
Not published (139): ASML, Spotify, SAP, Samsung Electronics, Toyota Motor Corporation, LVMH, L'Oréal, Bloomberg, Stripe, H&M Group, Inditex, The LEGO Group, Volkswagen Group, Honda, Hyundai Motor Company, Porsche, Airbus, Siemens, Philips, Alibaba Group, Baidu, Tencent, JD.com, Rakuten Group, Panasonic, SoftBank Group, Mitsubishi Corporation, LY Corporation, Recruit Holdings, Mercari, CyberAgent, Shiseido, NTT, Deutsche Bank, Adyen, Barclays, Zalando, Vodafone, Rolls-Royce, Carlsberg, Heineken, YouTube, Notion, Dyson, Telefónica, BASF, Macquarie Group, The Swatch Group, BBVA, Munich Re, Orange, ING Group, Michelin, Commonwealth Bank of Australia, Zurich Insurance Group, Audi, Lufthansa Group, Vestas, Danone, KONE, Bosch, Burberry, Kering, Sanofi, DBS Bank, Hermès, Huawei, AXA, BNP Paribas, Fujifilm, KDDI, Commerzbank, Dentsu, SEGA, Kao, Square Enix, Bandai Namco, UniCredit, Yamaha, Intesa Sanpaolo, MIXI, ASOS, Xero, Kirin Holdings, Nokia, Asahi Group Holdings, Olympus, Daikin, ANA, Money Forward, Nissan, Sansan, DeNA, NEC, Bridgestone, Denso, ZOZO, Cybozu, KOKUYO, Saint-Gobain, Okamura, Henkel, Obayashi, Sumitomo Corporation, Nikon, ITOKI, Mitsui & Co., ABN AMRO, ENGIE, Telenor, Rabobank, Société Générale, CaixaBank, Nordea, Pirelli, Repsol, Crédit Agricole, Wärtsilä, Continental, GitHub, Pixar Animation Studios, Canva, BT Group, Takeda, Generali, Sun Life, Swedbank, Endesa, Cboe Global Markets, Suncorp, Medibank, Imperial Oil, Cencora, APA Corporation, Fivetran, Glenmede, Davis Wright Tremaine, Whole Foods Market, Oberoi Realty. These companies don’t publish this figure, so we don’t rank them.
Questions
Which company has the highest annual revenue?
Among the 180 companies on eciffo that publish it, Amazon ranks first with $717B, followed by Walmart ($713B) and Apple ($416B).
What is a typical annual revenue at big companies?
The middle company in this ranking, adidas, has $28.0B. Half of the 180 ranked companies are above that and half below.
Where do these numbers come from?
Revenue for the latest fiscal year, in U.S. dollars, from each company’s annual report (converted where the company reports in another currency). Companies that don’t publish the figure are not ranked; eciffo never estimates.
More rankings
-
 The oldest big companies in the worldNo. 1: Intesa Sanpaolo · 463 years
 -
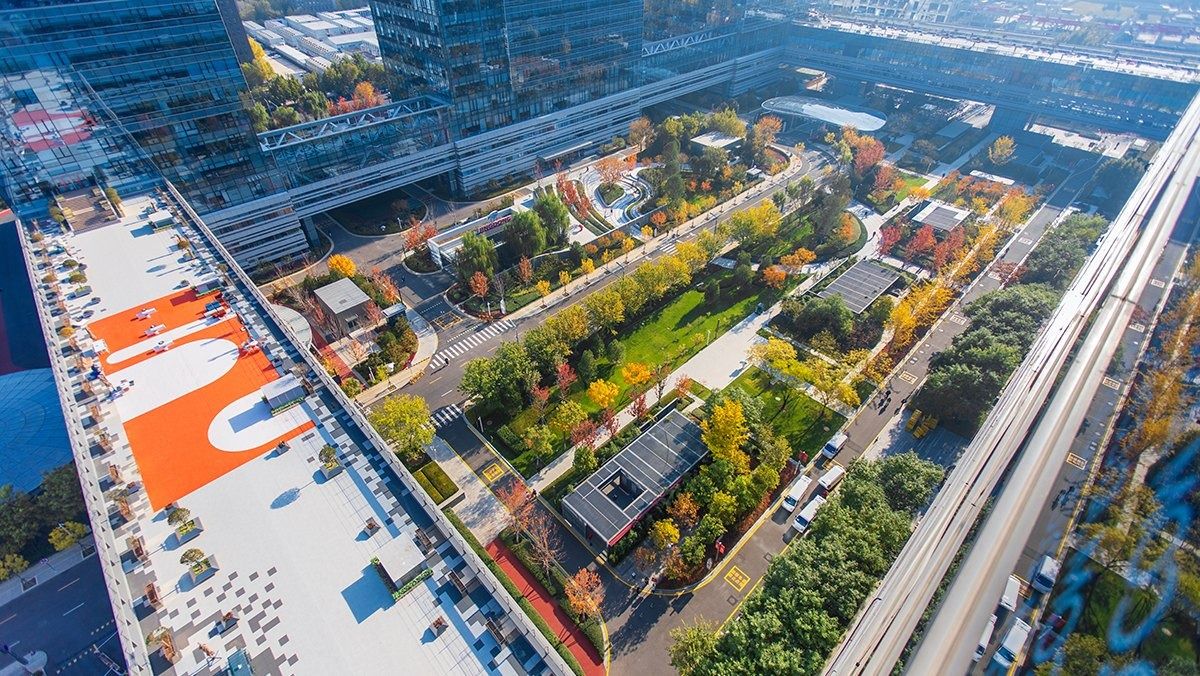 The biggest company headquarters in the worldNo. 1: JD.com · ≈15.2M sq ft
 - Companies with the highest median employee payNo. 1: Meta · $388,200
- CEO pay ratio: how many times the median worker the CEO earnsNo. 1: Wayfair · 5,702×
-
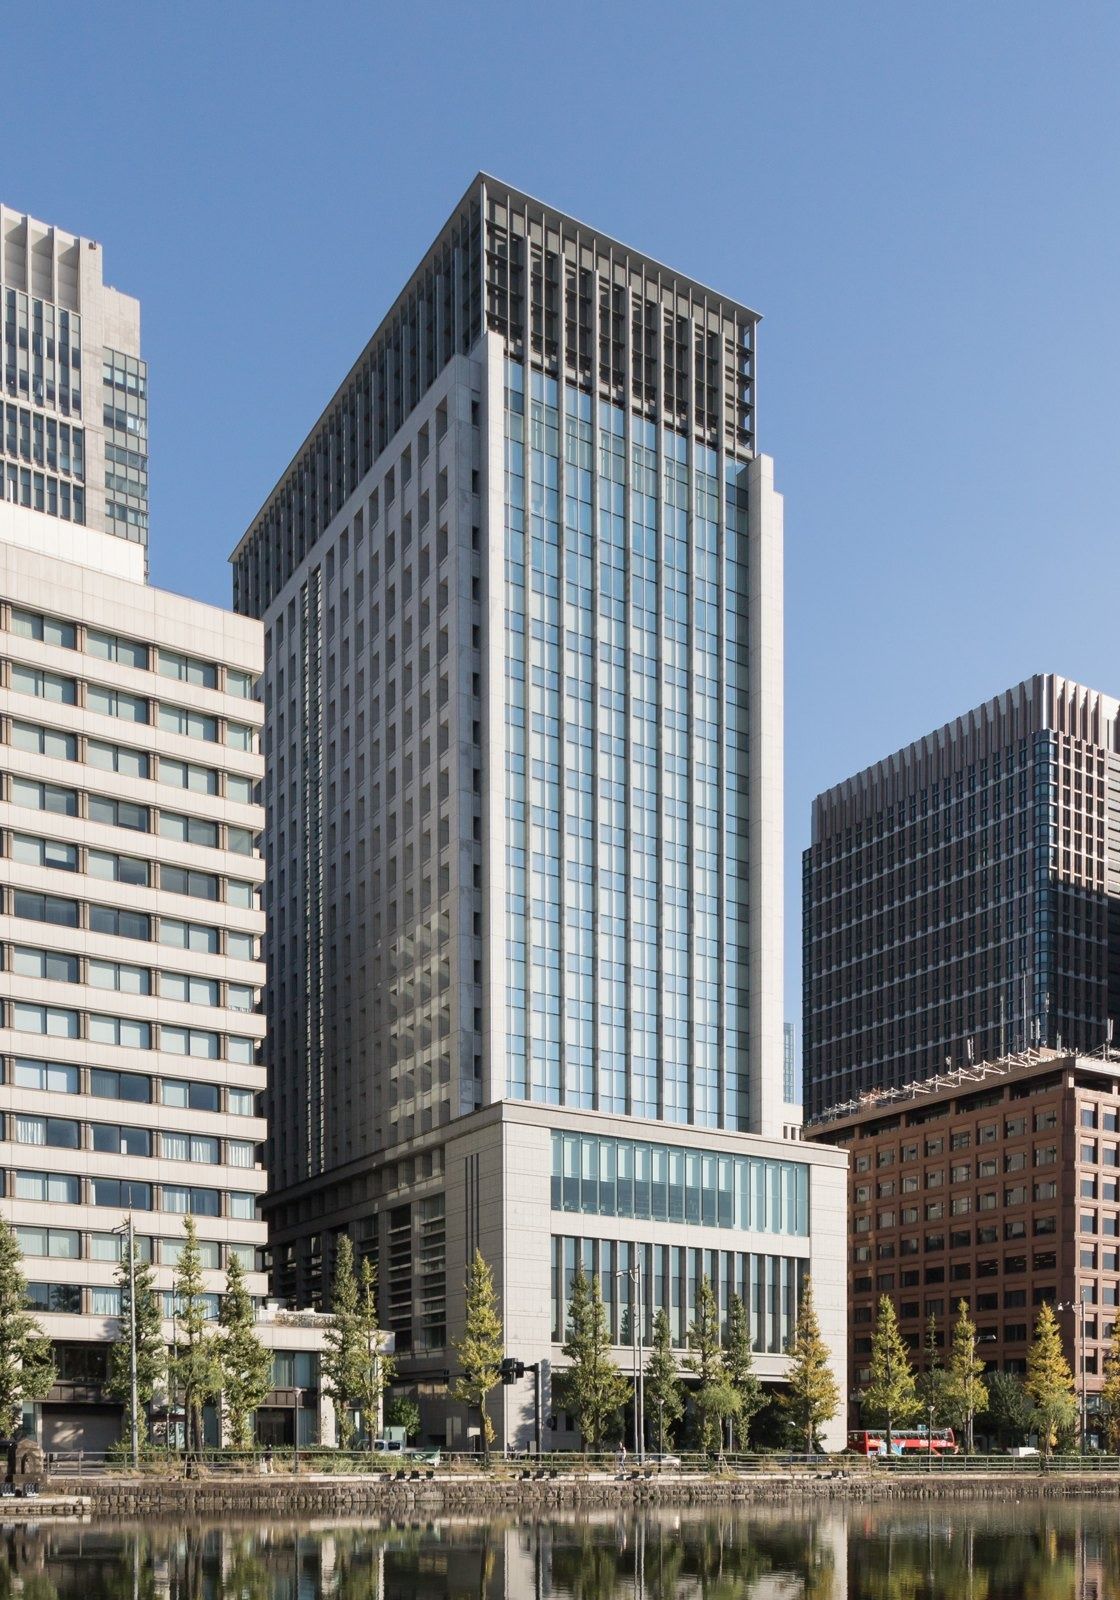 Companies with the lowest employee turnoverNo. 1: Mitsubishi Corporation · 0.75%
 - The companies with the most employeesNo. 1: Walmart · ≈2,100,000